


Measuring the Sales Impact of Improving Inventory Records
How improving the accuracy of inventory records can grow sales by 4-8%
Table of Contents:
- Abstract
- Introduction
- - Understanding the problem of inaccurate inventory records
- - How automatic inventory management systems work, and how inaccurate inventory records distort their output
- - How we measured the impact of more accurate inventory records on sales
- How big is the problem of inaccurate inventory records?
- - The number of SKUs affected by inventory inaccuracies
- - Understanding positive and negative inventory record inaccuracies
- - The size of inventory inaccuracies
- - Inventory inaccuracies by product category
- - How inaccuracy develops over time
- - How inaccuracy develops as a function of manual adjustments
- How do inaccurate inventory records impact sales?
- - Results by retailer indicate that more accurate inventory records deliver a 4-8% sales increase
- - How improving inventory records grow sales at different rates per product category
- Practical recommendations and conclusions
Languages :
There is a growing body of evidence to suggest that retailers’ inventory records are inaccurate to a significant extent. And it is reasonable to assume that the higher the inventory record inaccuracy (IRI), the higher the impact on sales. But what does this mean in real terms? This report describes the outcome of a 3-year project (conducted with the participation of 7 of Europe’s largest retailers) the aim of which is to quantify the IRI problem and demonstrate the sales lift resulting from fixing it. A structured test-control type experiment is used, according to which test stores are subjected to stock counts at some particular point in time, whereas control stores are not, allowing us to measure the effect of reconciling (or not) the stock records on sales. The analysis covers approximately 1 Million stock keeping units (SKUs) sold in about 100 stores; such data is of a different order of magnitude to anything previously attempted in the academic and practitioner literature, leading to important, reliable and trustworthy conclusions. We find that about 60% of the SKUs analysed are affected by inventory record inaccuracies. We also find that positive IRI is as prevalent as negative IRI, with the same detrimental effects though on sales. Very importantly, correcting inventory inaccuracies is found to lead to approximately 4% to 8% of increased sales in the participating retailers. Interestingly, this applies to all retailers including the particularly ‘accurate’ ones. The results demonstrate that the biggest opportunity for improvement comes from high-volume expensive items, and detailed analysis by product category shows which categories should attract most attention. Finally, we discuss and show results on how inventory accuracy deteriorates over time following a stock count. This has implications for deciding how often and when stocktakes should take place. Our findings should be of great value to retailers to: i) inform their decisions on the appropriate levels of resource and investment against improving inventory records accuracy; ii) prioritise investments per product category and class; iii) appreciate the behaviour of positive and negative discrepancies; iv) discuss counting as a sales increase strategy rather than a cost-intensive necessity.
Abstract
There is a growing body of evidence to suggest that retailers’ inventory records are inaccurate to a significant extent. And it is reasonable to assume that the higher the inventory record inaccuracy (IRI), the higher the impact on sales. But what does this mean in real terms? This report describes the outcome of a 3-year project (conducted with the participation of 7 of Europe’s largest retailers) the aim of which is to quantify the IRI problem and demonstrate the sales lift resulting from fixing it. A structured test-control type experiment is used, according to which test stores are subjected to stock counts at some particular point in time, whereas control stores are not, allowing us to measure the effect of reconciling (or not) the stock records on sales. The analysis covers approximately 1 Million stock keeping units (SKUs) sold in about 100 stores; such data is of a different order of magnitude to anything previously attempted in the academic and practitioner literature, leading to important, reliable and trustworthy conclusions. We find that about 60% of the SKUs analysed are affected by inventory record inaccuracies. We also find that positive IRI is as prevalent as negative IRI, with the same detrimental effects though on sales. Very importantly, correcting inventory inaccuracies is found to lead to approximately 4% to 8% of increased sales in the participating retailers. Interestingly, this applies to all retailers including the particularly ‘accurate’ ones. The results demonstrate that the biggest opportunity for improvement comes from high-volume expensive items, and detailed analysis by product category shows which categories should attract most attention. Finally, we discuss and show results on how inventory accuracy deteriorates over time following a stock count. This has implications for deciding how often and when stocktakes should take place. Our findings should be of great value to retailers to: i) inform their decisions on the appropriate levels of resource and investment against improving inventory records accuracy; ii) prioritise investments per product category and class; iii) appreciate the behaviour of positive and negative discrepancies; iv) discuss counting as a sales increase strategy rather than a cost-intensive necessity.

Introduction
Understanding the problem of inaccurate inventory records
To manage inventory levels, companies usually employ software tools that use inventory and sales data to automatically forecast demand and replenish warehouses and store shelves.1 In the retail sector, companies spend around 1% of annual sales on acquiring and operating such systems [1].
One weakness of automatic inventory management systems is that replenishments are triggered based on inventory levels recorded in the system, which can differ from the inventory that is actually available in the retail store or warehouse. If the inventory management system displays a stock level that is higher than the inventory level actually available, then inventory is replenished too late, which can lead to stockouts and the company not being able to satisfy customer demand. If the system displays a lower than actually available inventory level instead, the replenishment is made too early, which leads to unnecessary high inventory levels [2, 3]. In both cases, inaccurate inventory records prevent the (costly to install and operate) stock management system to unfold its full potential and diminish profits. Inaccurate inventory records may have various sources, including incorrect manual adjustments of stock records, employee or customer theft, damage or spoilage, wrong shipments, or check-out errors [1, 2, 4, 5].2
Another problem inaccurate stock records may bring about is the need to perform frequent ‘gap scans’, i.e. to send employees to the store or warehouse to manually check if shelves have been depleted. Costs associated with such activities (that could obviously be saved if the inventory management system would correctly indicate the quantity of items left on the shelf) can be immense. Given that most retail stores spend almost 10% of their sales on labour expenses [6], reducing the number of gap scans without sacrificing inventory accuracy could substantially improve profits.
Inaccurate stock records constitute a tremendous problem especially in the retail sector. Earlier research found that the share of incorrect inventory records may range between 65% and 80% ([1, 4]), where inaccurate inventory records may indicate both higher or lower inventory levels than are actually available in the store. DeHoratius and Raman [1], for example, who analysed 37 stores of a US retailer, found that 65% of the inventory records they examined were inaccurate; the absolute difference between the actual inventory level and the one recorded in the inventory management system for a stock keeping unit (SKU) was 35% of the available inventory on average at this retailer. Inaccurate stock records are thus an important driver of inventory stockouts that lower customer service levels and reduce sales in the retail sector [7, 8, 9].
Stockouts refer to situations where a particular stock keeping unit is not available, such that the company cannot satisfy customer demand, leading to losses in sales and customer goodwill.
One can differentiate between store-out-of stock situations, where the item is not available at the retailer’s premises at all, and shelf-out-of stock situations, where the item is available instore, but where shelves are nevertheless empty and customers are consequently not able to buy the item [3]
Retailers that wish to alleviate problems resulting from inaccurate inventory records could adopt the following measures:
- 1Implement preventive measures to avoid inventory records becoming inaccurate, for example by using RFID systems to reduce counting or check-out errors (e.g., [10]), or introducing (more) rigid quality control in the goods receiving area of stores;
- Implement corrective measures to remove inaccuracies from the inventory records, for example by means of periodic stock counts (e.g., [11]), or ongoing gap scans;
- Accept the inaccuracy and use an inventory management system that explicitly takes account of the error and replenishes shelves accordingly (e.g., [5]).
Interestingly, measure 3 is not readily available yet, i.e., to the best of the authors’ knowledge, there are no software packages that factor IRIs in their replenishment calculations.3 Measures 1 and 2 are associated with a considerable additional cost, e.g. for counting the stock or for implementing and operating the RFID system. Hence, retailers have to compare the extra cost of improving/better managing inventory records with the sales increase resulting from more accurate stock data. However, the impact that inaccurate inventory records have on sales has never been examined in a scientific study.4 Any previous evidence, important as it is, may admittedly be termed anecdotal.
Our work considers the impact of measure 2. As much as we would have liked to also consider the effect of measure 1, lack of any information related to the use of RFID or any other preventive approach at the participating retailers means that we have only examined the impact of stock counts.5
We present the results of a rigorous extensive study on the impact of inventory record accuracy improvements on sales in the retail sector. We investigate such impact via a test-control-type experiment, in which we subject test stores to stock counts that are not performed in the control stores. Comparing both types of stores enables us to gain insights into the impact of removing IRI from the inventory data. The sales uplift may then be contrasted to the cost of stock count(s) and informed decisions can be made with regards to the stock count policy and investment.
Stock counts are viewed as a necessity in the retail sector; they are often performed for audit purposes and in situations where stores are relatively empty to minimize the effort associated with the count. We will show in this report that stock counts are actually more than a cost-intensive necessity; they may rather play an important role in increasing a retailer’s sales as well.
The following section explains in some more detail how inaccurate inventory records distort the output of automatic inventory management systems. Section 1.3 then outlines the research questions addressed in this work.
Inventory record inaccuracy (IRI) is the discrepancy between the inventory level recorded in the inventory management system and the actual inventory level found in the store [3, 12]. Some retailers define a discrepancy zone (e.g., one unit or one percent of the units recorded in the system for that particular SKU) within which no error is assumed to exist [13]. This study assumes that the inventory records of a SKU are inaccurate if the number of units of that SKU available in the store differ from the inventory level recorded in the system (even if the difference is just a single unit), and consequently does not adopt a discrepancy zone approach.
How automatic inventory management systems work, and how inaccurate inventory records distort their output
There are different ways for automating inventory replenishment decisions.6 To illustrate how inaccurate inventory records may distort inventory management systems leading to either stockouts or unnecessary high inventory levels, we explain one inventory replenishment principle that is very frequently used in retailing in the following.
The inventory management system tracks inventory available per SKU in each retail store over time. The inventory level recorded in the system is reduced each time an item is scanned at the checkout counter or when another removal of inventory is recorded in the system (say when damaged or spoiled items are removed from the shelves of the store, and when employees record these removals in the system). When a replenishment is received at the store, the inventory record is increased again. Many retailers specify a socalled re-order point for triggering inventory replenishments. When the inventory record reaches this re-order point, the inventory management system automatically places an order (at the distribution centre or supplier) to replenish the store’s inventory. After a certain lead time, the order that was automatically placed is received into inventory at the retail store. This principle is illustrated graphically in Figures 1a and 1b (solid green lines).
If inventory records are inaccurate, the stock that is actually available in the store differs from the inventory recorded in the inventory management system. The discrepancies between the recorded and the available inventory levels can be both negative or positive. The case of negative discrepancies is illustrated in Figure 1a. In this case, drivers such as theft, misplacement, or unrecorded damages lead to an additional consumption of inventory not captured by the inventory management system. The actual inventory in the store (dashed green lines in Figure 1a) is consequently lower than the recorded inventory (solid green lines in Figure 1a).
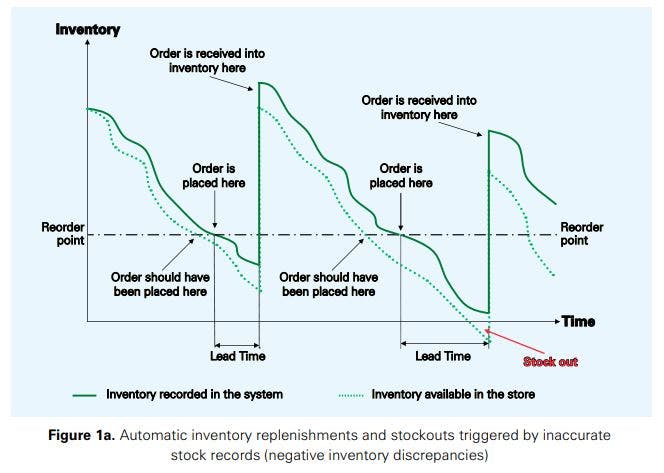
The consequence is that orders are placed too late, which increases the risk of a stockout. This leads to losses in sales over time. In the example presented in Figure 1a, the inventory management system would even not be aware of the stockout, as the inventory level displayed in the system is positive all the time.
The case of positive inventory discrepancies is illustrated in Figure 1b. In this case, drivers such as additional deliveries, wrong scans at the checkout counter or lost products that are found again (but not recorded in the system) lead to a situation where the available inventory for a particular SKU is higher than the inventory recorded in the system. The consequence is that orders are placed too early, leading to unnecessary inventory in the system that causes extra costs.7
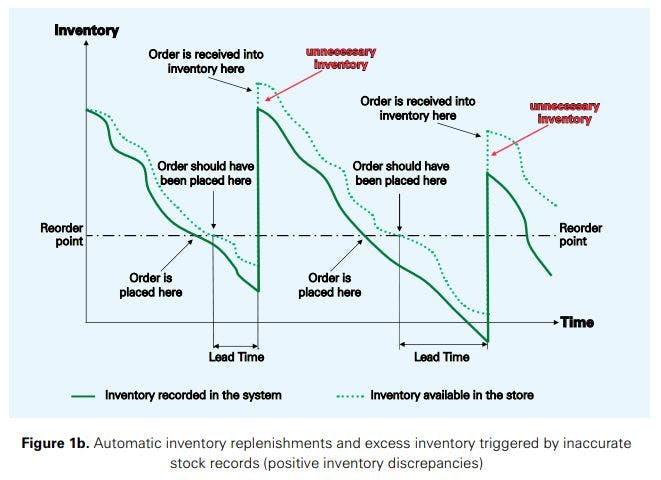
The two situations illustrated in Figures 1a and 1b can occur interchangeably for the same stock keeping unit, i.e., a SKU can suffer from negative inventory discrepancies in one period leading to stockouts, which then turns into a situation with positive inventory discrepancies and unnecessary inventory in another period.8
The Research questions addressed in this project
To gain insights into how inaccurate stock records influence sales in the retail sector, our research project aimed at, progressively, answering the following main research questions:
- 1To what extent are inventory records inaccurate in retailing?
- How do inventory records deteriorate over time?
- How does an improvement in inventory record accuracy affect sales?
First we consider the magnitude of the inventory record inaccuracy problem (percentages of SKUs that are affected and size and direction (positive, negative) of the errors). We expand this analysis into product categories, but also product classes (in traditional ABC classifications).
An ABC analysis ranks a number of items in decreasing order of annual €/£/$ value (price multiplied by number of items sold over a year) or other criteria.9 This array is then split into three classes, referred to as A, B and C (see, e.g., [14]). A items are usually a relatively small number of items contributing, collectively, to a large share of the total turnover (e.g., 20% of items accounting for 70% of the total turnover), whereas C items are commonly a relatively large number of items contributing, collectively, to a relatively small share of the total turnover (e.g., 50% of items accounting for 5% of the total turnover). B items range in-between the other two classes both with respect to item number and turnover contribution.
Subsequently, we evaluate how inventory accuracies decline over time following a stock count. When a stock count is undertaken, physical and information system inventories are reconciled. Knowledge on how quickly (and by how much) the inventory record accuracy (IRA) declines over time allows a better understanding of how often (and when) a stocktake is needed. This has important cost implications and may help companies balancing the relevant investments with the sales uplift. It also means that retailers are called to revisit the very purpose of stock counts and the motivation behind the timing and frequency with which they are introduced. As previously discussed, stock counts are predominantly viewed as audit-compliance and cost intensive exercises10 that: i) are introduced when the warehouse or store is at its emptiest to make the task easier and less costly to perform11; ii) their frequency is motivated by the trade-off between cost savings versus correcting accuracy deterioration. Their role as an enabler of increased sales is ignored.
To that end, we look at linking accurate inventory data to sales increases (or conversely, inaccurate inventory data to missed sales potential). We know very little about this important relationship which should be instrumental when making decisions about the investment and resources committed towards addressing inventory record inaccuracies.
Before we discuss our results in detail, we first provide some key information on the methodology we have followed to conduct our analysis. This is described in the next section.
Overview of the methodology
This research was undertaken working closely together with seven retailers (in four European countries) in the grocery/general merchandise and fashion/apparel sectors. Figure 2 illustrates the main steps of the methodology used for the purposes of this project. Once the work was commissioned by ECR, we conducted extensive semi-structured telephone and face-to-face interviews with retailers to frame the problem area, scope the study and gain insights into the retailers’ perception of problems associated with inaccurate inventory records. The retailers’ consent to protocol the interviews was obtained, and subsequently a protocol was prepared for all interviews that lasted about one hour each. This provided us with rich material to i) appreciate important operational details pertinent to each of the retailers; ii) determine the methodological arrangements of our study; iii) specify the research questions we set out to answer.

After signing Non-Disclosure Agreements (NDAs), the retailers transferred sales and inventory data to the research team. The primary data transfer process involved in many occasions physical visits at the retailers’ premises to better understand their operations, discuss details related to the data, clarify algorithmic complexities and, very importantly, agree on objectives and deliverables that were of interest to the particular retailer. The analysis for each retailer consisted of two parts: i) a generic part, that covered the deliverables and research questions collectively addressed in this project, across all retailers; ii) a retailer-specific part, that addressed research questions of interest to that particular retailer. Data transfer itself was achieved in a variety of ways, in accordance to each retailer’s data safety protocols.12
A data analysis template was created in Excel (complemented by a series of sub-routines developed in Visual Basic for Applications, VBA) to standardise, to the extent possible, the data analysis process (or at least the generic part of it). This was not easy to achieve given the millions of records processed for some of the retailers, and indeed the data analysis part of the project was a particularly demanding one. After appropriately structuring the data to facilitate statistical analysis, various tests were performed on the data to answer the research questions. Analysis of the results was complemented by follow-up discussions with the retailers, and frequent feedback obtained in the ECR Shrinkage & On-Shelf Availability Group events in Barcelona (Feb. 2017), Dusseldorf (May 2017), Paris (Feb. 2018), Brussels (Oct. 2018), and Copenhagen (June 2019) and other presentations given to academic and practitioner audiences.
The project closed with interpreting the results and deriving managerial insights and recommendations.
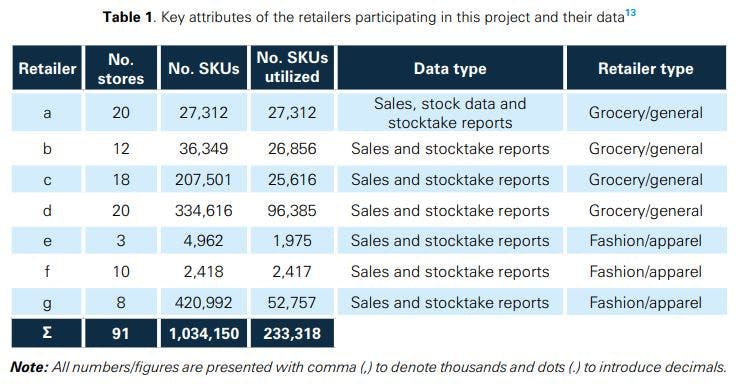
The names of the companies participating in the project cannot be disclosed, but some key information related to each of them appears in Table 1. Note that for retailer a, information was shared for three product categories only (wine & spirits, toys, and pet care), while the data we obtained for the other retailers covers their entire product portfolio. Further note that out of the approximately 1 million SKUs examined, we ended up using around 233,000 of them. These were the ones fully matching the experimental structure (to be discussed in Section 2.2). In Sections 3, 4 and 5 of this report, we will present average results across all retailers participating in this research, differentiate between the retailer groups ‘grocery/general’ and ‘fashion/ apparel’ where applicable, and, where possible (needed), provide some retailer-specific results.
How we measured the impact of more accurate inventory records on sales
The data used for the purposes of this work was collected in two experiments that are explained in detail below.
Experiment I
Retailers participating in the project selected a number of (matched) pairs of stores. For each given pair of stores, one of those stores was allocated to the test group and one to the control group. The matching was undertaken either by the company (based on managerial knowledge) or by the research team (on the basis of an algorithm developed), or, in some cases, by both (as the outcome of discussions between the retailers and the research team). In any case, the criteria considered for matching stores related to the location type (city store, urban, etc.), size of the store, management and technological capabilities.
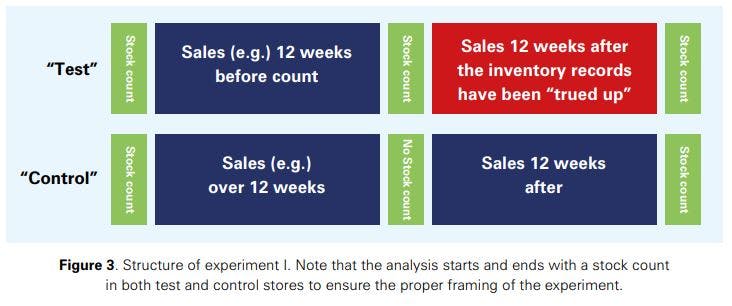
For both test and control stores, after an initial stocktake, sales and inventory record data14 was tracked for 12 weeks.15 Then, a stocktake was performed at all test stores of the retailers, and inventory record inaccuracies identified during the stocktake were corrected in the system. No stocktakes were undertaken in the control stores. Afterwards, sales and inventory record data was tracked for another 12 weeks, and a stocktake was performed again at all stores (test and control). This experiment enabled us to observe
- the magnitude of inaccurate inventory records at the participating retailers by comparing inventory information indicated in the information system with the stock found in the stores during the stock audits (Research question 1);
- Ithe effects of correcting the inventory records (at the test stores) versus not fixing the inventory records (at the control stores) (Research question 3).
In some cases, all the above had already taken place in the past, so it was a matter of retrieving appropriate data to enable conducting our experiment. In some other cases though, this happened in real time – i.e. the retailers designed / introduced stock counts to match our experimental suggestions. The structure of the experiment is illustrated in Figure 3
There were about 233,000 SKUs used for reaching conclusions. These were the SKUs matching the experimental structure discussed above, i.e. they were sold both before and after the time the stock audit took place in the middle of the experiment (in the test stores) and were also included in the stock audit(s) themselves. There was an additional constraint we introduced to ensure avoiding comparing apples with oranges. An ABCtype classification was employed to categorize items as fast, medium and slow movers, and all the SKUs considered in our research were in the same class both in the test and the control stores. We discuss the ABC classification and related results in Section 3.4.
Experiment II
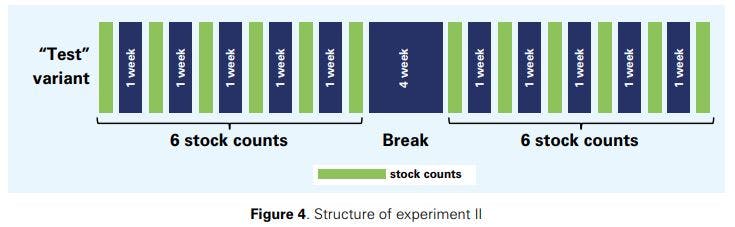
At retailer a, an additional experiment was conducted. At test stores selected by the retailer, an initial stocktake was performed, and inventory record inaccuracies identified during the stocktake were removed from the system. Afterwards, five additional consecutive stocktakes were performed at the end of the following five weeks. Inventory record inaccuracies identified during the stocktakes were recorded, but not removed from the system. After a total of six stocktakes, a break of four weeks was scheduled, and then six additional stocktakes were completed, again without removing inaccuracies from the data. This allowed us to track inventory record changes over time in parallel with actual inventory changes and develop a better understanding of the behaviour of the system (Research question 2). There were about 27,000 SKUs used for reaching conclusions. The structure of the experiment is illustrated in Figure 4.
2.3. Further information
There were a number of other important issues that have been taken into account when analysing the data, the discussion of which goes beyond the scope of this report. However, let us briefly mention here that we have considered: i) the time series characteristics: the very purpose of specifying ‘reasonably’ long intervals (12 weeks) before and after the stocktake that took place in the test stores was to be able to control for such issues as trend and seasonality; ii) promotions: the experiment was conducted in such a way that sales were filtered for the effects of promotions (if any) that would otherwise distort the analysis.
Nevertheless, it is important to note that this work was not about establishing causality and no relevant information has been collected from the participating retailers. This means that we have not constructed regression-type models that link our response variable (IRI) to a number of independent variables that (potentially) have some explanatory power. As such, we are not able to ‘explain’ the results in a statistical sense but rather we use feedback from our discussions with the retailers and references to the work conducted by others to interpret our findings and ‘infer’ causality. Similarly, any question (hypothesis) that seeks to establish explanatory linkages like ‘what is the effect of conducting the stock counts internally or outsourcing the task to external organisations?’ may also not be answered (addressed) as part of this research. Causality is to be considered in the next phase of this work and we will return to this issue in the last section of the report where we outline possible extensions of our research.
Before we close this section, let us say that we have tried to keep this report as plain and non- technical as possible, meaning that we opt for the presentation of averages (and descriptive statistics), leaving aside any qualifications related to the statistical significance testing we have conducted to substantiate our findings. For any enquiries regarding the technical (statistical) aspects of this work, please feel free to contact any of the authors of this report.
How big is the problem of inaccurate inventory records?
The number of SKUs affected by inventory inaccuracies
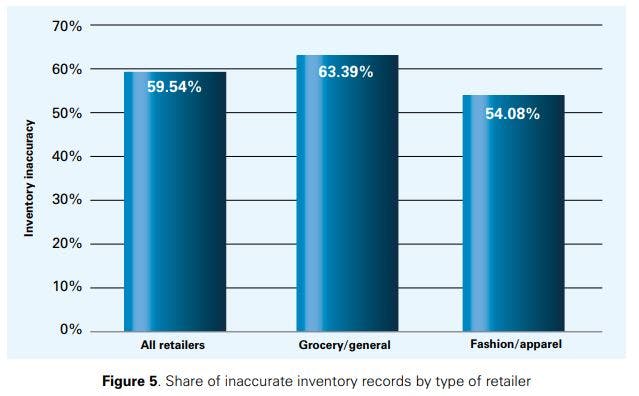
Our first objective was to gain insights into the magnitude of inaccurate inventory records. Figure 5 shows that for 59.54%16 of the audited SKUs, the (physical) quantity on stock did not match the quantity displayed in the information system at the time of the stocktake. The share of inaccurate stock records is higher for the grocery/general merchandise retailers (63.39%) than for the fashion/apparel ones (54.08%). Discussions with the collaborating retailers indicated that this result may be due to the fact that grocery/ general merchandise retailers, generally, deal with a (much) larger product portfolio than the fashion/ apparel ones (which is certainly the case for the companies that have participated in the experiment), which exposes them to factors driving IRI more often. This does confirm earlier research on inventory record inaccuracies and, more generally, stockouts, which has found that the annual selling quantity is an important driver of IRI/stockouts ([1,15]). Another important issue is that in grocery retailing, customers often shop larger numbers of items at once; if you shop food, it is ‘normal’ to buy say 50 items (of different SKUs) at once, but you would probably not buy 50 pairs of shoes at once. Buying larger numbers of units at once renders mistakes more likely at the checkout counter due to time pressure and the sheer volume of items that need to be processed. Finally, in grocery retailing, storage space on the shelf is often an issue17 such that it is not possible to have inventory for an entire day on the shelves – in contrast to fashion retailing, where this is often the case. Given also that the backrooms often do not provide much space for storing items, grocery retailers depend more on an efficient and well-organized replenishment system, but are also, as a consequence, more exposed to errors in this respect.18
Please note that the figures reported here, and elsewhere in this report, are weighted averages; that is, the reported figures take into account the number of SKUs considered for each retailer. If, for example, the IRI is 40% in retailer y (with 20,000 SKUs audited), and 50% in retailer z (with 10,000 SKUs audited), then the average IRI is not 45% [= (40% + 50%) / 2], but rather: [(40% x 20,000) + (50% x 10,000)] / 30,000 = (8,000 + 5,000) / 30,000 = 13,000 / 30,000 = (approximately) 43%.
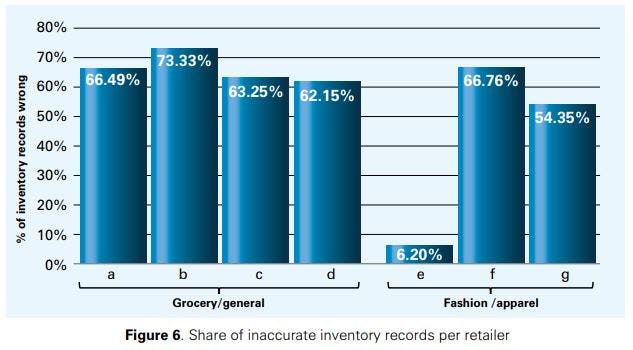
Figure 6 shows the share of SKUs affected from inaccurate inventory records per retailer. As can be seen, between 6.20% and 73.33% of the SKUs suffer from inaccurate stock data. For three of the retailers (retailers a, b and f), the share of inaccurate inventory records exceeds estimates published in earlier studies (65% reported in [1]).
At retailer e, the share of inaccurate inventory records was surprisingly low (6.2%). We have visited some stores of this retailer and we can attribute this result to the relatively small size of the backrooms19 in conjunction with the relatively low number of SKUs per store: this leads to very frequent replenishments from the Distribution Centre / Warehouse to stores as well as high levels of stock monitoring with a low probability that products are lost in the backroom or shelf area. In addition, products at retailer e are relatively expensive compared to the other two fashion/apparel retailers, which has prompted management to adopt several measures to reduce IRI, the most important one being the high security employed (central manned camera system in each store).20
Finally, the result can be further explained in terms of the small number of SKUs audited in that retailer; please see Table 1. Our experimental structure requires the same SKUs to be present before and after the test stock count, something that is somewhat difficult to achieve in this case due to the very short life cycles associated with the products under concern, resulting in a rather small number of SKUs considered. We note that the relatively small share of SKUs affected by IRI at retailer e does not imply that improving inventory record accuracy is not important for this retailer. In contrast, our results presented below will show that a further reduction in IRI leads to a substantial improvement in sales at this retailer as well.
Understanding positive and negative inventory record inaccuracies
Figure 7 illustrates the direction of the inventory discrepancy observed during stock counts. As can be seen, inventory discrepancies are not predominantly negative: across all retailers, 27.46% of the SKUs analysed during the experiment suffered from positive inventory discrepancies. Negative inventory discrepancies play a more prominent role than positive ones, especially for grocery/general merchandise retailers where 38.52% of the SKUs were found to suffer from the former (compared to 24.87% suffering from the latter). We attribute the difference between grocery/general merchandise and fashion/apparel retailers to several sources of shrinkage that are typically more important in grocery than in fashion retailing, such as spoilage, decay and product damages. Earlier research of Adrian Beck [16], for example, reported that inventory shrinkage caused by selfcheckout solutions are typically higher in the grocery retail sector than in non-grocery (though we do not have information in this project that links stores to self-checkout infrastructure). These results are also confirmed by earlier research of the National Retail Federation where inventory shrinkage was reported more than twice as high for the grocery than for the fashion/apparel sector [17].
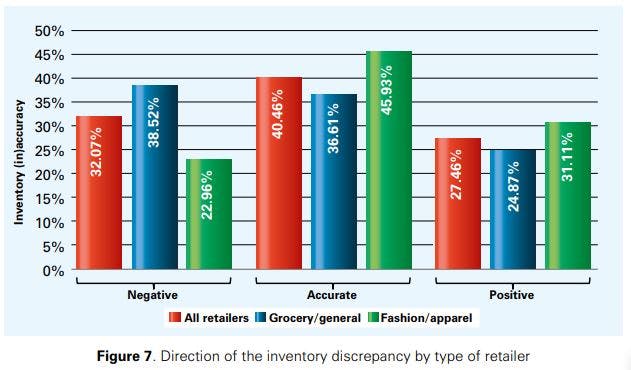
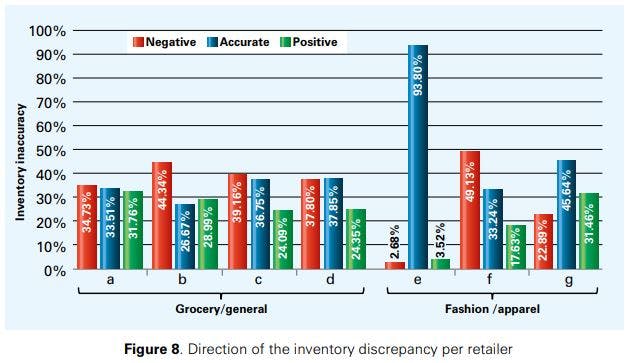
Figure 8 shows the direction of inventory discrepancies per retailer. Interestingly, for two of the fashion/apparel retailers, positive discrepancies exceed negative ones. This may be attributed to product returns that are very frequent in the fashion sector [18]. Providing customers with the opportunity to return a product induces increased sales [19, 20], but the more frequent the returns are (or the higher their volume) the greater the risk of not always being correctly entered into the system (added to the inventory records) despite being available in the store again.
Fashion/apparel retailer f shows a different behaviour with negative discrepancies exceeding positive ones. The retailer under concern deals with beauty products; such products are of relatively small sizes and are intuitively expected to be more prone to theft and damage than regular fashion items.
The size of inventory inaccuracies
Figure 9 shows the average magnitude of the inventory discrepancy (in units) observed during stock audits per type of retailer.21 As can be seen, the average discrepancy for grocery/general merchandise retailers is 8.78 (-8.24) units for positive (negative) discrepancies, while it is only 3.65 (-2.94) units for fashion/apparel retailers.22 Interestingly, average positive inventory discrepancies were found to be larger for both groups of retailers than negative discrepancies.
Combining the results shown in Figure 9 with those presented in Figure 5 above, it becomes clear that grocery/ general merchandise retailers suffer more from IRI than fashion/apparel retailers both with respect to the number of SKUs affected as well as with respect to the magnitude of the problem, which could be a result of higher turnover rates and a consequent higher exposure to drivers of IRI. As will be discussed later in this report, the fact that fashion/apparel retailers have lower discrepancy rates and a lower unit discrepancy on average does not mean that IRI is less of a problem in that sector. Given that fashion items often have a higher average unit value than grocery items, removing inaccuracies from inventory data has an equally important impact on sales in the fashion/apparel sector as in grocery/general merchandise.
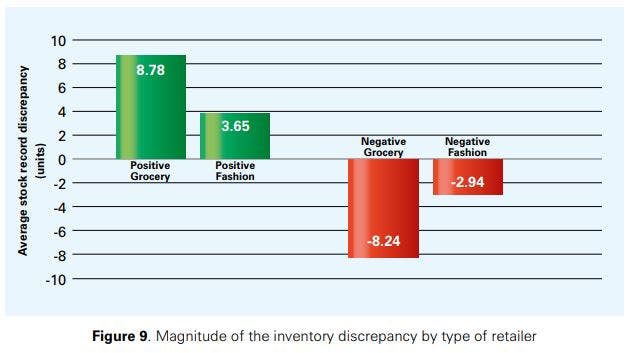
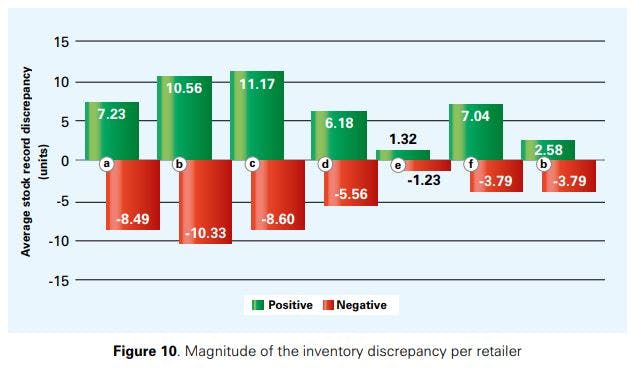
Figure 10 displays the average magnitude, in units, of the inventory discrepancy observed during stock audits, per retailer. In contrast to Figure 9, we do not have a consistent result here that positive discrepancies have a higher magnitude than negative ones; instead, the magnitude depends on the retailer23. The results show an average (across all retailers) IRI of +6.58 and -5.97 units for positive and negative discrepancies, respectively.
Inventory inaccuracies by product category
We now investigate how different product categories contribute to inventory inaccuracies. Figures 11 and 12 analyse the discrepancy contribution of different SKUs in an ABC-type way for both grocery/general merchandise and fashion/apparel retailers.24
For the grocery/general merchandise retailers (Figure 11), it can be seen that 19.39% of the SKUs are fast movers (A items) generating 70.30% of sales. These SKUs are also responsible for 49.23% of the total inventory discrepancies (in value). Middle movers (B items) represent 25.91% of the SKUs at the grocery/ general merchandise retailers that contribute to 19.98% of sales. These SKUs are responsible for 25.26% of the inventory discrepancies (in value). Slow movers (C items) represent 54.69% of the SKUs that generate 9.73% of sales. These items account for the remaining 25.51% of the inventory inaccuracies (in value). For the fashion/apparel retailers, the results are similar (see Figure 12); the major difference between the two groups is that for fashion/apparel retailers, slow movers contribute somewhat more to the total inventory discrepancy than they do at the grocery/general merchandise retailers, even though they have a slightly smaller share in the total number of SKUs in the former case.
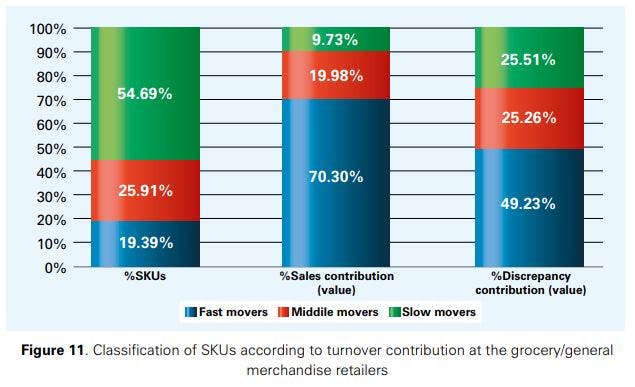
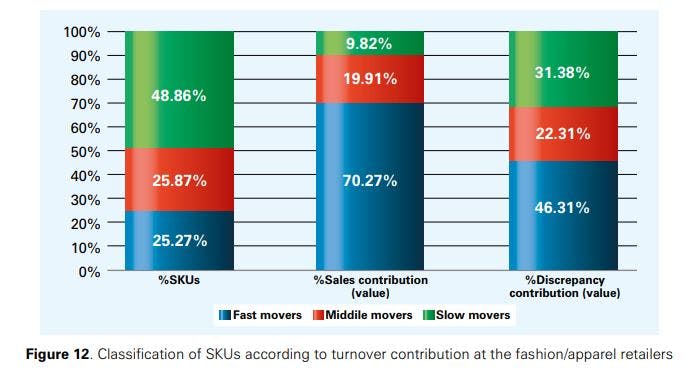
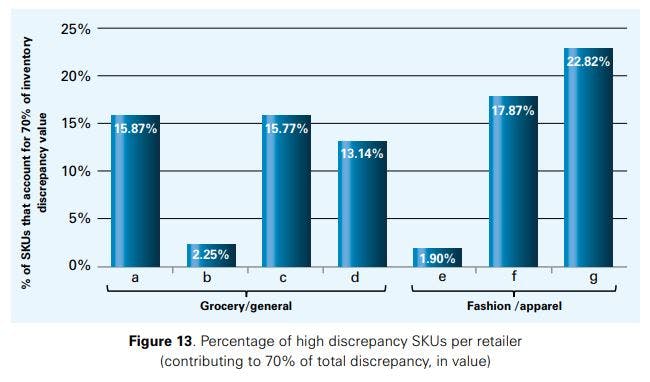
Figure 13 shows the share of SKUs at the different retailers that contribute to 70% of the total inventory discrepancies (in value). As can be seen, at retailers b and e, 2.25% and 1.90% of the SKUs cause 70% of the total discrepancies. For these retailers, our results imply that correcting the inventory data of this relatively small set of SKUs would remove most of the inaccuracies from the inventory management system.25 With respect to the other retailers, the share of high discrepancy SKUs ranges between 13.14% and 22.82%.26 Even though these proportions are much higher than those associated with retailers b and e, the results again illustrate that a relatively small number of SKUs generates the major share of the total inventory discrepancy at most of the retailers.
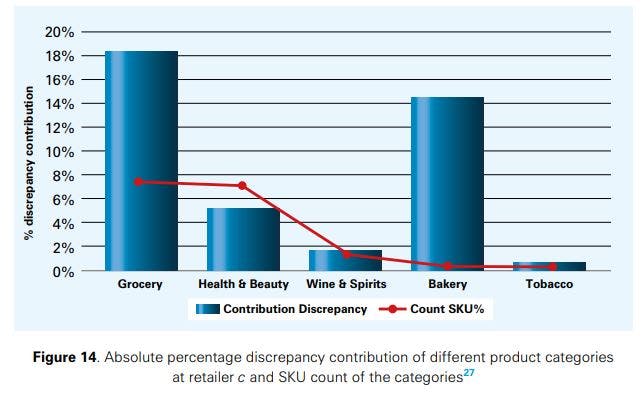
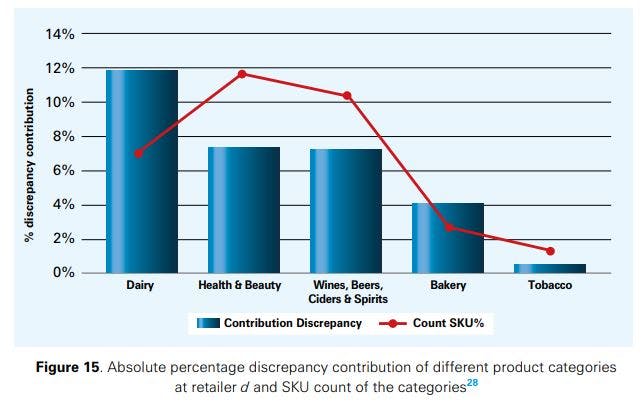
Figures 14 and 15 analyse the contribution of main product categories to the total inventory discrepancy for retailers c and d (these are the retailers for which detailed analyses could be conducted at the category level). At retailer c, classical grocery and bakery products are subject to the highest inventory discrepancy (with a contribution to the total inventory discrepancy of more than 10% in both cases), while dairy is the single most important IRI driver at retailer d. Health & beauty products as well as wine & spirits have a low to medium percentage discrepancy value at both retailers, while tobacco has only a low share in it; it is, almost invariably, displayed close to the checkout counter, which reduces shrinkage. The behaviour of the product categories generally seems to be quite retailer-specific, which confirms the need of a company-specific analysis of IRI in the retail sector. We also noted a weak relationship between the number of SKUs handled in a product category and the category’s contribution to IRI, such that a higher number of SKUs per category leads to higher inventory discrepancies. This was not the case for bakery products at retailer c and dairy at retailer d.
How inaccuracy develops over time
Experiment II explained in Section 2.2 enables us to investigate how stock records deteriorate over time. Figure 16a shows how accurate SKUs as well as SKUs suffering from IRI develop over time (bars); the trend line approximates the development of the share of accurate SKUs. An interesting result we obtained is that negative inaccuracies clearly accumulate over time; positive discrepancies, however, seem to remain relatively stable. One reason for this result could be that positive discrepancies can be caused by misplaced items that are removed from inventory records during gap scans, later to be found again. Temporary losses in inventory resulting from misplacements can to some extent balance each other out over time, e.g. when a particular item is lost and another one is found again. Negative discrepancies are often caused by shrinkage that translates into a permanent loss of items, leading to an accumulation of discrepancies over time. In any case, this result clearly motivates the need for further scientific research on the drivers and behaviour of negative and positive discrepancies.
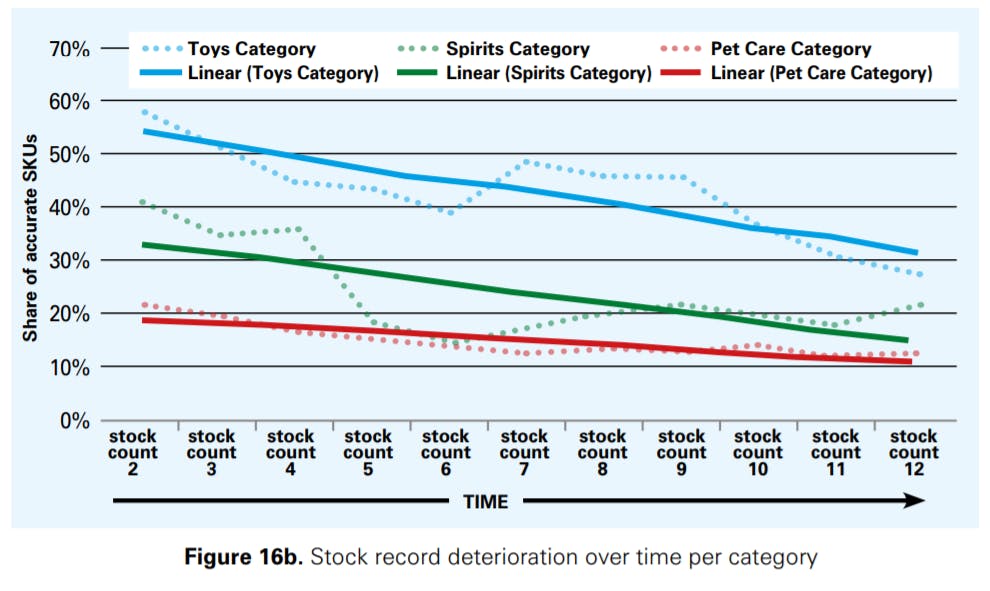
In Figure 16b we show how the stock records deteriorate over time per product category. The accuracy as well as its deterioration over time (again approximated by a trend line for each product category) depends on the category. Categories with a high accuracy level (the case of toys) are found to be more sensitive to deterioration over time than categories with a low accuracy level (pet care).
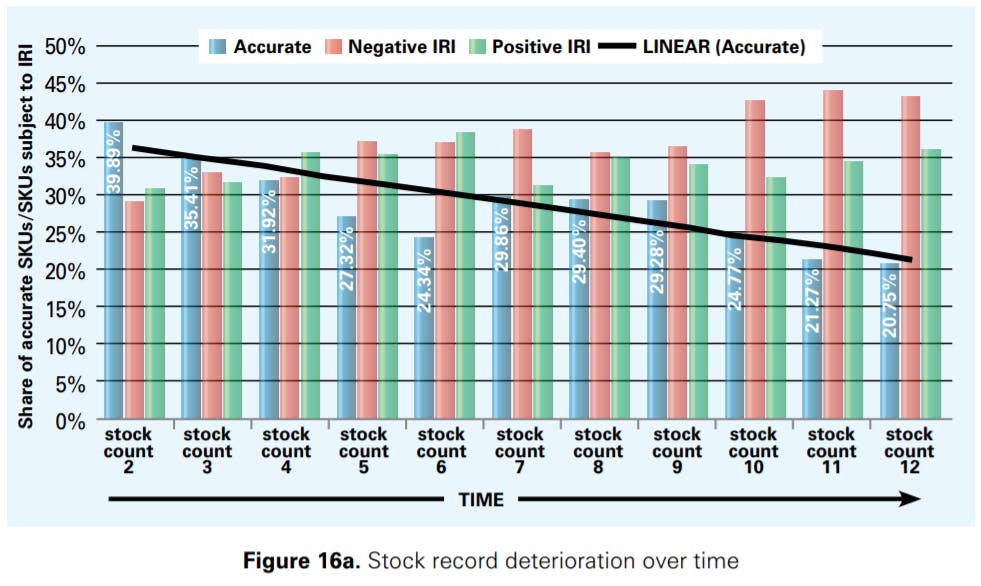
"We don’t know how inventory records deteriorate in our company. Does it reach 74% a week after the stocktake, or does it degrade over the next months? We just don’t know. But before we can fix the issue, we need to understand it."
The data provided by retailer a enabled us also to analyse the problem of SKUs with a stock level that is “frozen” at 0 for several subsequent periods. At the times of the stock counts, we found that approximately 15.07% of the SKUs at retailer a had a physical stock level of zero that reduced sales to zero in the subsequent week. More importantly though, we found that a total of 2,402 SKUs (8.8% of SKUs) faced this issue for the entire duration of the experiment at this retailer, resulting in a complete lack of point of sales (POS) signals for the affected SKUs. Inventory freezing is a particularly important issue and one that may substantially impact sales.
Inventory freezing describes a situation where stock records are positive displaying a stock level above the retailer’s reorder point even though the physical quantity on hand is zero. In such a situation, the inventory management system will not trigger replenishments, leading to a physical stock that is zero for many periods. SKUs with a frozen inventory level may obviously not be sold. The inventory management system, if not properly linked to point-of-sales data, could not detect this problem, as the positive stock level would indicate regular operations.29
How inaccuracy develops as a function of manual adjustments
Retailer a also provided us with information on how often, and at what magnitude, stock records were manually adjusted by the store employees. This enabled us to relate the magnitude of manual interventions in the inventory management system with the inventory discrepancies observed during stock audits.
In this analysis, the details of which go beyond the scope of the discussion here, we have considered two different approaches to calculate the IRI, termed as #1 and #2. The results are presented in Figure 17.30
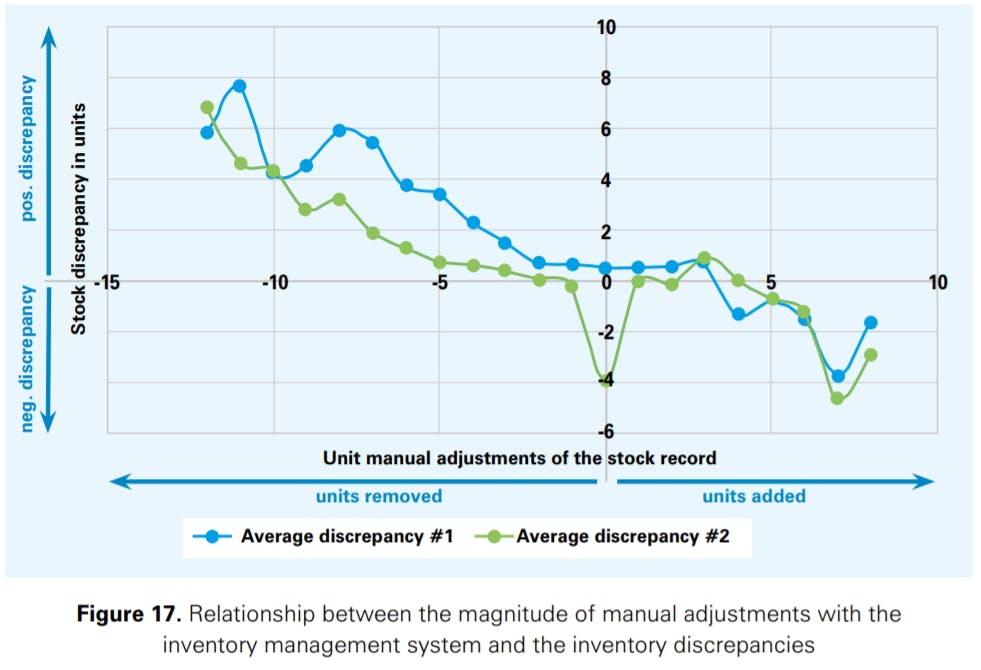
The results show that there seems to be a clear relationship between the magnitude of manual adjustments in the inventory management system and the inventory discrepancies. Manually removing stock from the inventory records seems to lead to positive inventory discrepancies over time, while manually adding stock to the records seems to have the exact opposite effect. The more ‘intense’ the manual interventions are (i.e. adding more or removing more units over time), the higher the distortion of the stock records’ quality is. Our findings thus reflect some of the (relevant) concerns expressed by the collaborating retailers.
"There is a concern that if you make gap scans too frequently, you drive inventory inaccuracy. So where is the optimal point of touching the stock records?"
"If the stock record accuracy deteriorates too much between two full stocktakes despite gap scans, would it make sense to remove the gaps scans altogether in order not to have to invest in those hours?"
How do inaccurate inventory records impact sales?
Results by retailer indicate that more accurate inventory records deliver a 4-8% sales increase
In experiment I outlined in Section 2.2, a stocktake was performed in the test stores in the middle of the experiment to remove inventory discrepancies from the information system, while no stocktake was conducted at the control stores. The better resulting inventory record accuracy for the test stores reduces the effects of (some of) the stockout drivers (referred to in Section 1.2), which leads to (as we will show) higher sales.
We calculate the sales increase resulting from the stock audit as follows: (total sales in the test store in the entire observation period after the stocktake – total sales in the control store in the entire observation period after the stocktake) / total sales in the control store in the entire observation period after the stocktake.31 Note that in matching test and control stores, we made sure that they are comparable with respect to the main store characteristics (e.g., size, location, product portfolio, sales prior to the stock count etc.) to ensure that our results are meaningful. For the same reason, we included in the analysis only SKUs that were classified in the same way both in the test and the control stores (e.g., A items in the test stores need to be A items in the control stores to be included in the analysis).
Figure 18 shows that the test stores display an increase in average sales after the stocktake as compared to the control stores. The benefit resulting from the stocktake is positive for all retailers participating in the experiment, and it ranges between 3.83% and 8.38% with an average of 5.98% across all retailers.32 The sales impact of better stock accuracy we discovered is much higher than what DeHoratius and Raman [1] reported in their 2008 study, where the loss in revenue resulting from IRI was estimated to be slightly larger than just 1%.33
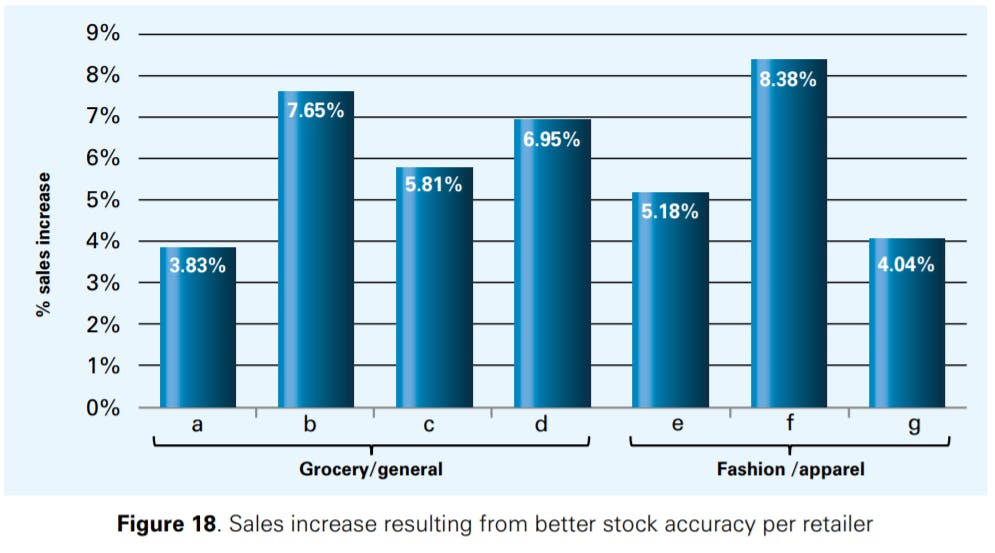
Figure 19 shows the average percentage sales increase after the stock count for different item classes. As can be seen, especially fast movers (A items) benefit from more accurate inventory data. Given that fast movers are usually only a relatively small number of SKUs, correcting inaccurate stock data for such items seems to be a practical and important lever for increasing sales. This does also facilitate prioritising the allocation of (scarce) resources, that should be directed to counting the A items first.
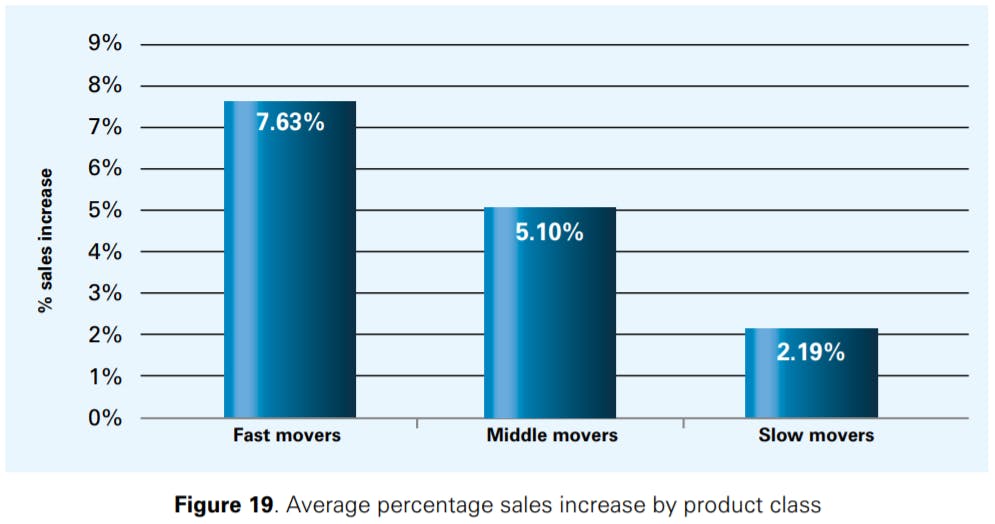
Figure 20 shows that the SKUs suffering from high inventory discrepancies benefit the most from an improvement in stock accuracy; for high discrepancy products, the sales lift was found to be more than 14% in the period after the stocktake. For medium discrepancy products, the sales increase was still slightly larger than 7%, while it was 2.11% for low discrepancy products.
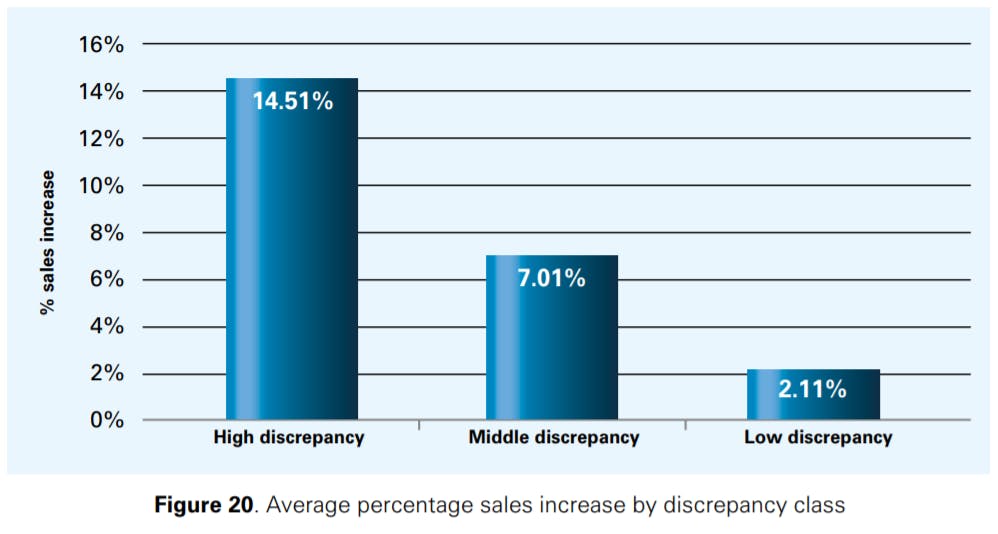
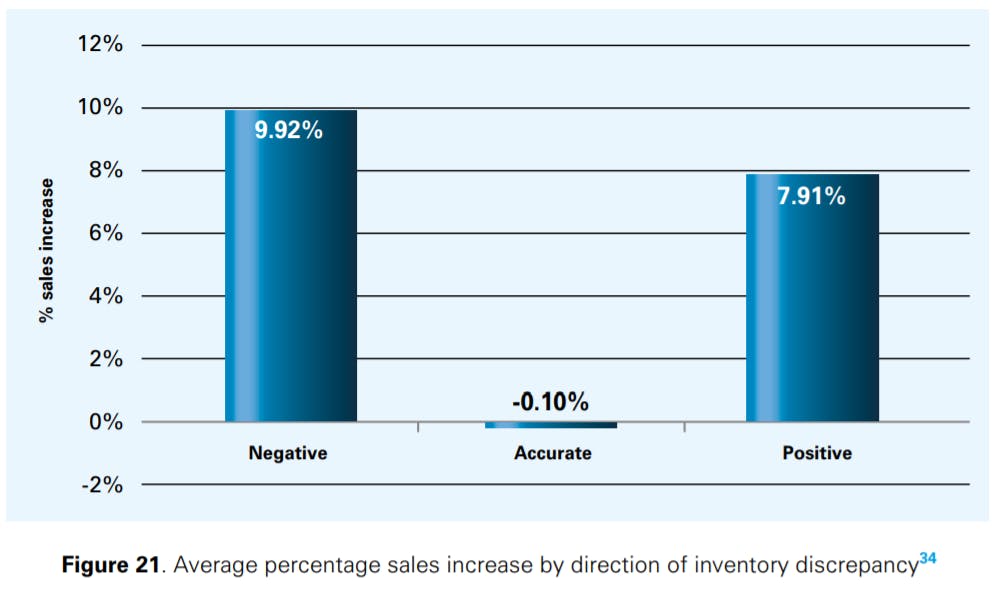
Figure 21 shows that correcting inventory information leads to sales increases both for negative and positive inventory discrepancies. While it is intuitively appealing to expect that correcting negative discrepancies will lead to a sales uplift (in light of the stockout risks described in Section 1.2), we did not expect that correcting positive inventory discrepancies would also have an impact on sales uplift. In our discussions with the retailers (and from our analysis of the data we were provided with), we found, however, that surplus stock not captured by the inventory management system often occurred in the backroom of the retail stores where customers were unable to access it. In such cases, employees look the item up on their hand held, see that it shows no inventory, assume it is not in the store and then re-order rather than going searching for inventory the system says does not exist. At the same time, shelves are not being replenished triggering stockouts and lost sales despite the surplus inventory that is kept in the store, in either the backroom or other multiple display locations in the store for promotional, impulse sales or adjacency reasons.
"If we knew what a one pound-investment into improving inventory accuracy brings in terms of sales, we could use this information in our discussions with the board to argue for better inventory accuracy."
"The industry struggles with having an on-going benefit from stocktaking."
How improving inventory records grow sales at different rates per product category
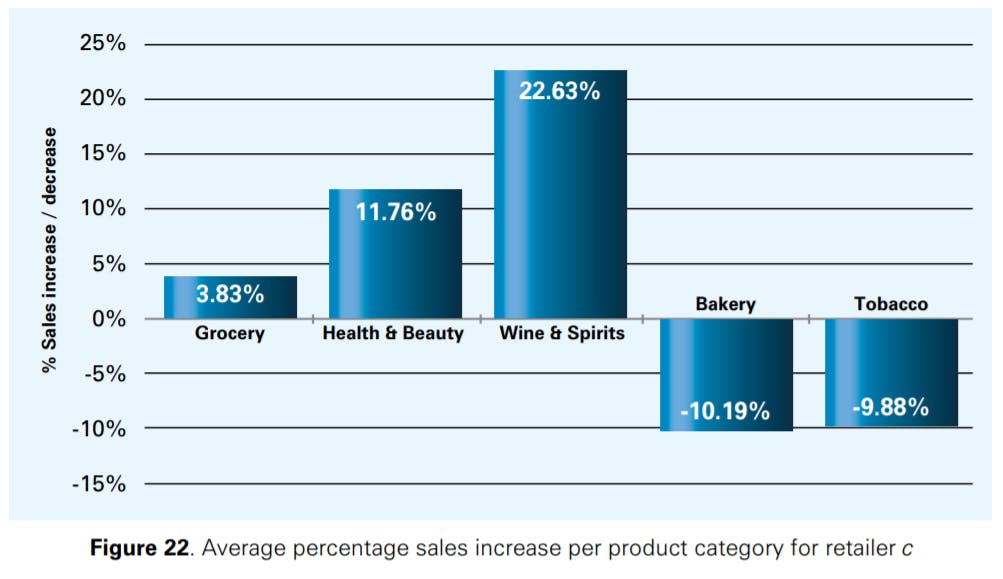
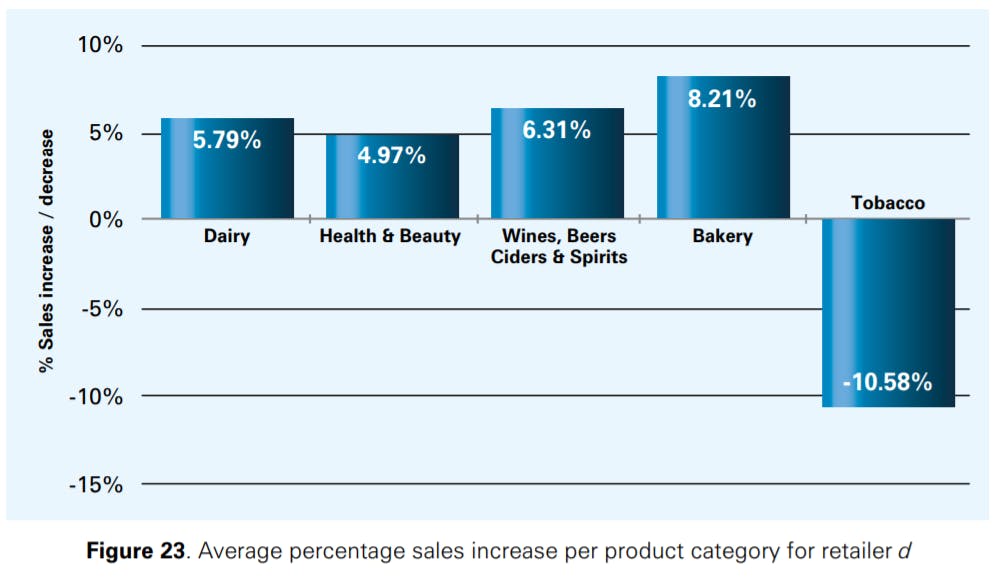
Figures 22 and 23 show how the different product categories discussed already in Section 3.4 contribute to an increase in sales at retailers c and d. 35 At both retailers, correcting IRI via a stocktake led to an increase in sales of more than 10% for some of the product categories. For some SKUs though, we found that correcting IRI actually led to a reduction in sales. The SKUs that displayed such behaviour were primarily those disproportionately affected by internal and/or external theft, such that correcting IRI and increasing stock levels led to higher shrinkage rates that again reduced sales. One retailer informed us that it had also observed lower sales after stock counts for a few items in the past (e.g., for tobacco). This happened when incorrect shipments arrived at the retailer’s stores or a burglary occurred, inducing the retailer to count the stock at the store in question. In this case, the event triggering the stock count was responsible for the decrease in sales, and not the stock count itself. Other items that had lower sales after the stock records had been reconciled are items that are often heavily marked down if an inventory surplus remains at the end of the day (e.g., bakery). If this surplus inventory is removed from the store, there is no need to mark down products anymore, which in this case reduced sales. We conclude, however, that further research is required to understand why a reconciliation of stock records may lead to a reduction in sales in some cases.
Practical recommendations and conclusions
Achieving retail growth in mature markets is not easy – yet we put forward important evidence that growth can be found simply by making inventory records more accurate.
Our analysis uses an extremely rich and sizeable dataset that is of a different order of magnitude to anything previously attempted before in the academic and practitioner literature. We have found the IRI problem to be as big as previously reported in other studies, but we have shown it to be associated with different magnitudes in different sectors. In particular, IRI seems to be bigger in grocery/general merchandise than in fashion/ apparel retailing. This should be taken into account when benchmarking against average performances. The above results are true when it comes to the magnitude of the errors (discrepancy in number of units). Saleswise, this is a big problem in both sectors, and in fact higher sales increases resulting from a correction of IRI seem to occur in fashion/apparel. Generally, we have demonstrated that if the sales opportunity is to be taken into account, the IRI problem is (much) bigger than previously thought to be across the board in the retailing industry.
We have also found that positive discrepancies are as common as negative ones, and we think that this will change the way the IRI problem is perceived and actions taken to alleviate it. It is not all about shrinkage; backroom operations may help explain a big part of the problem too. It is interesting that the grocery/general merchandise and the fashion/apparel sectors suffer (mostly) from negative and positive discrepancies, respectively; and this should be useful for targeting the right IRI drivers.
Further, our analysis suggests, conclusively, that removing IRI from the stock records benefits fast movers and high discrepancy items the most; for high discrepancy products, the sales lift was found to be more than 14% in the period after the stocktake. So, an immediate strategy would be to concentrate on high discrepancy fast movers; this should be a low number of items, but with a very high impact on sales. Counting these items more frequently could also help retailers to avoid costly stock counting routines that often target the entire product portfolio.
Very importantly, there is a need to change management perceptions on counting. Stock takes are perceived as a necessity, and they are indeed. However, they also constitute a tremendous opportunity to boost sales. When is it best to introduce a stock count? Just before the big sales season or the quietest time of the year? The industry goes for the latter, associating stock takes with a necessity and interruptions, though we argue for the former, given the opportunity for sales uplift that should be even more marked in high selling seasons. Stock takes and their timing needs to be seen as a sales increasing strategy; their cost needs to be contrasted to the potential sales increase before relevant decisions are being made.
Our operationalised suggestions are summarized as follows:
- Positive and negative discrepancies stem from different sources. Check which type of IRI (positive or negative) is bigger. If negative, look at shrinkage. If positive, look at your backroom!
- Repeat the experiment described in this report (A-Z instructions on how to do so follow at the end of the report) and calculate the sales increase that stocktakes can generate. Contrast that to the cost of the stocktakes and then you have a good idea about your return on investment.
- Rethink the purpose of stocktakes. These are not (only) a necessity. They are an opportunity to reach better strategic decisions in increasing sales; and trading such uplift off with the investment needed to achieve it. Involve your sales teams in the process of defining your stocktake strategy.
- Prioritise your efforts in sorting out IRA. The ‘law of vital few’ applies here too. There is always a high discrepancy category that if sorted out the effect on aggregate results is disproportionally higher than fixing all the rest of the items together.
We hope the findings of this report will be useful for the retailing sector to improve operations and increase sales. This is the biggest analysis to-date in this area, and the number of companies involved and SKUs analysed gives us confidence in the results. We invite every retailer to repeat the experiment we have conducted and see for themselves the benefits of correcting inventory records and prove out some of the theories put forward in this report. To do so, we present the main steps of the experiment in an Appendix at the end of the report.
More remains to be done to link the results we present to their root causes, and use the findings reported here to inform appropriate interventions. We look forward to continuing our work with ECR in pursuit of these developments.
Y. Rekik, A.A. Syntetos, C. Glock
Appendix: Experiment replication
- Select a list of test/control stores having the same/similar (broadly defined) operational capabilities (e.g. type of store, sales area, backroom area, IT infrastructure, replenishment policies, turnover).
- Select a set of SKUs that are shared between the test and control stores and for which the scheduled stock counts are compatible with Experiment I as illustrated in Figure 3. There are two options here:
a. Do this in real time. Plan the experiment and schedule opening and closing counts for both test and control stores, and a middle count for the test stores.
b. Alternatively, do this retrospectively. Check historical information on stock counts / stores / SKUs and conveniently select historical data that matches the prescribed setting. - Track/measure sales of the selected SKUs in the test and control stores before and after the stock count in the middle of the experiment for the test stores.
- Cluster the SKUs based on their contribution to sales in both the test and control stores (Fast/Middle/Slow sales contribution classification). The outcome of this exercise helps deducing the most important SKUs based on sales contribution as illustrated in Figures 11 and 12.
- Cluster the SKUs in the test stores based on the inaccuracy data (High/Middle/Low inaccuracy classification) and based on the sign of the inaccuracy (Negative/Accurate/Positive inaccuracy classification). This leads to results illustrated in Figures 5 to 11. A breakdown of this clustering can be done by categories (as illustrated in Figure 14 and 15).
- Cluster the SKUs based on product categories and examine the results. Some categories respond better to counting, and therefore should give a higher ROI.
- Validate that the test/control matching is strong. For this purpose, compare the share of common sales classes of SKUs between the test and control stores: % of SKUs being fast/middle/slow in both test and control store.
- Compare sales after the test store middle stock count for each SKU and aggregate the results across all test/control stores for all SKUs (which can lead to what is illustrated in Figure 18), break down the comparison based on the sales classification (Figure 19), the inaccuracy classification (as illustrated in Figure 20), the inaccuracy sign (as illustrated in Figure 21), the SKU category (as illustrated in Figure 22), or any other criterion (e.g. sales department, type of store) that may be of relevance / interest to you.
List of references
- N. DeHoratius and A. Raman, “Inventory record inaccuracy: An empirical analysis,” Management Science, vol. 54, no. 4, pp. 627-641, 2008.
- B. C. Hardgrave, J. A. Aloysius and S. Goyal, “Does RFID improve inventory accuracy? A preliminary analysis,” International Journal of RF Technologies: Research and Applications, vol. 1, no. 1, pp. 44-56, 2009.
- H. H.-C. Chuang, R. Oliva and S. Liu, “On-shelf availability, retail performance, and external audits: A field experiment,” Production and Operations Management, vol. 25, no. 5, pp. 935-951, 2016.
- Y. Kang and S. B. Gershwin, “Information inaccuracy in inventory systems: stock loss and stockout,” IIE Transactions, vol. 37, no. 9, pp. 843-859, 2005.
- Y. Rekik, A. A. Syntetos and C. H. Glock, “Modelling (and learning from) inventory inaccuracies in e-retailing/B2B contexts,” Decision Sciences, In Press.
- Workforce, “Labor and Benefits Expenses in Supermarkets,” 30 January 2004. [Online]. Available: https://www.workforce.com/2004/01/30/labor-and-benefits-expenses-in-supermarkets/#1. [Accessed 29 April 2019].
- D. Corsten and T. Gruen, “Desparately seeking shelf availability: an examination of the extent, the causes, and the efforts to address retail out-of-stocks,” International Journal of Retail & Distribution Management, vol. 31, no. 12, pp. 605-617, 2003.
- J. Aastrup and H. Kotzab, “Analyzing out-of-stock in independent grocery stores: an empirical study,” International Journal of Retail & Distribution Management, vol. 37, no. 9, pp. 765-789, 2009.
- J. C. Ehrenthal and W. Stölzle, “An examination of the causes for retail stockouts,” International Journal of Physical Distribution & Logistics Management, vol. 43, no. 1, pp. 54-69, 2013.
- B. C. Hardgrave, J. A. Aloysius and S. Goyal, “RFID-enabled visibility and retail inventory record inaccuracy: Experiments in the field,” Production and Operations Management, vol. 22, no. 4, pp. 843- 856, 2013.
- R. F. Rinehart, “Effects and causes of discrepancies in supply operations,” Operations Research, vol. 8, no. 4, pp. 543-564, 1960.
- S. Goyal, B. C. Hardgrave, J. A. Aloysius and N. DeHoratius, “The effectiveness of RFID in backroom and sales floor inventory management,” The International Journal of Logistics Management, vol. 27, no. 3, pp. 795-815, 2016.
- G. M. Sheppard and K. A. Brown, “Predicting inventory record-keeping errors with discriminan analysis: A field experiment,” International Journal of Production Economics, vol. 32, no. 1, pp. 39-51, 1993.
- R. H. Teunter, M. Z. Babai and A. A. Syntetos, “ABC Classification: Service Levels and Inventory Costs,” Production and Operations Management, vol. 19, no. 3, pp. 343-352, 2010.
- A. C. McKinnon, D. Mendes and M. Nababteh, “In-store logistics: an analysis of on-shelf availability and stockout responses for three product groups,” International Journal of Logistics: Research and Applications, vol. 10, no. 3, pp. 251-268, 2007.
- A. Beck, “Self-checkout in Retail: Measuring the Loss,” ECR Community Shrinkage and On-shelf Availability Group, Brussels, 2018.
- N. R. Federation, “The 2015 National Retail Security Survey,” 2015.
- S. Cullinane, M. Browne, E. Karlsson and Y. Wang, "Retail clothing returns: A review of key issues," 2017.
- H. Saarijärvi, U.-M. Sutinen and L. C. Harris, “Uncovering consumers’ returning behaviour: a study of fashion e-commerce,” The International Review of Retail, Distribution and Consumer Research, vol. 27, no. 3, pp. 284-299, 2017.
- N. Janakiraman, H. A. Syrdal and R. Freling, “NoteThe Effect of Return Policy Leniency on Consumer Purchase and ReturnDecisions: A Meta-analytic Review,” Journal of Retailing, vol. 92, no. 2, pp. 226- 235, 2016.
- A. Raman, N. DeHoratius and Z. Ton, “Execution: The missing link in retail operations,” California Management Review, vol. 43, no. 3, pp. 136-152, 2001.
- E. A. Silver, D. F. Pyke and D. J. Thomas, Inventory and Production Management in Supply Chains, 4 ed., Boca Raton: CRC Press, 2017.
- S. Mou, D. J. Robb and N. DeHoratius, “Retail store operations: Literature review and research directions,” European Journal of Operational Research, vol. 265, no. 2, pp. 399-422, 2018.
- M. A. Waller, A. Heintz Tangari and B. D. Williams, “Case pack quantity’s effect on retail market share,” International Journal of Physical Distribution & Logistics Management, vol. 38, no. 6, pp. 436-451, 2008.
- A. Beck, “Measuring the Impact of RFID in Retailing: Keys Lessons from,” ECR Community Shrinkage and On-shelf Availability Group, Brussels, 2018.


Main office
ECR Community a.s.b.l
Upcoming Meetings
Join Our Mailing List
Subscribe© 2023 ECR Retails Loss. All Rights Reserved|Privacy Policy