


The Problems & Opportunities of E-Commerce Returns
Managing Returns as a Profit Centre
Table of Contents:
- Abstract
- Introduction
- - A Growing Problem in online returns
- - What does it mean for organisations?
- - How we carried out the research
- What we saw as key problems of ecommerce returns
- - Lack of an understanding on ecommerce costs and losses in ‘Buy Online, Return in Store’ model
- - Complexity and disintegration of systems and processes
- - The Unintended Consequences of a ‘Customer First’ Culture
- - Organisational structures keeping pace with growing issues
- Challenges and unintended consequences
- - Controlling the increasing cost of returns
- - Complex customer communications
- - Sustainability and the circular economy
- Three Ways of Re-Thinking Returns
- - A Cost Calculator for returns from online business
- - Lean Returns in Retail
- - Rethinking for a circular economy
- Conclusion and future opportunities
Languages :
This study finds that returns from online sales, particularly returns to store, are seriously impacting company profits. A comprehensive investigation involved a desk study of 100 retailers’ online returns policies; a review of other existing studies; four in-depth case studies with major UK retailers, including over 25 interviews, observations and site visits; and another 17 structured interviews in the UK and Europe.
’Buy Online, Return in Store’ creates unexpected additional costs. For example, businesses have to find more physical space to store returns in their shops and use store staff to process returns. It has also been difficult for firms to integrate and develop underlying IT systems quickly enough to cope with the demands of online shopping and returns. Many businesses have complex procedures for managing returns. With little senior management oversight of the returns process, retailers find it difficult to pin down crucial information such as the rate of return and the costs of handling a returned item.
However, just a small reduction in the rates of returns and the additional costs can directly improve profitability. For an average company, the researchers estimate that a five percent improvement in the rate of returns has the potential to deliver real improvements (200 basis points) in net margin. Such improvements could be critical to help them deliver the services which customers expect (such as free delivery and returns) whilst keeping prices competitive.
Recommendations to improve the management of returns and increase profits from online sales include:
· Have a strategic plan to treat returns as a profit centre;
· Understand the true costs of returns and the potential opportunities to reduce these costs;
· Develop lean management thinking in returns to realise an effective omnichannel organisation;
· Manage the growing impact of returns to the business by simplifying and integrating IT systems;
· Make communications with customers and employees smarter as an inexpensive initiative that reduces costs of returns and increases income from secondary sales;
· Participate in the circular economy to create net benefits in terms of cash, corporate social responsibility and brand reputation.
Notice: This report is the result of academic research into the impact of returns on online sales. It’s written for retail businesses to help improve their service to shoppers. If you’re a shopper and / or researching product returns with the shopper in mind, and want to know more about shopper rights, please click here to read our blog, a Responsible Shopper’s Guide to Exchanges and Returns.
Abstract
This study finds that returns from online sales, particularly returns to store, are seriously impacting company profits. A comprehensive investigation involved a desk study of 100 retailers’ online returns policies; a review of other existing studies; four in-depth case studies with major UK retailers, including over 25 interviews, observations and site visits; and another 17 structured interviews in the UK and Europe.
’Buy Online, Return in Store’ creates unexpected additional costs. For example, businesses have to find more physical space to store returns in their shops and use store staff to process returns. It has also been difficult for firms to integrate and develop underlying IT systems quickly enough to cope with the demands of online shopping and returns. Many businesses have complex procedures for managing returns. With little senior management oversight of the returns process, retailers find it difficult to pin down crucial information such as the rate of return and the costs of handling a returned item.
However, just a small reduction in the rates of returns and the additional costs can directly improve profitability. For an average company, the researchers estimate that a five percent improvement in the rate of returns has the potential to deliver real improvements (200 basis points) in net margin. Such improvements could be critical to help them deliver the services which customers expect (such as free delivery and returns) whilst keeping prices competitive.
Recommendations to improve the management of returns and increase profits from online sales include:
· Have a strategic plan to treat returns as a profit centre;
· Understand the true costs of returns and the potential opportunities to reduce these costs;
· Develop lean management thinking in returns to realise an effective omnichannel organisation;
· Manage the growing impact of returns to the business by simplifying and integrating IT systems;
· Make communications with customers and employees smarter as an inexpensive initiative that reduces costs of returns and increases income from secondary sales;
· Participate in the circular economy to create net benefits in terms of cash, corporate social responsibility and brand reputation.
Introduction
Within the EU 68% of Internet users reported shopping online in 2017 (1). Globally, business to consumer e-commerce was expected to increase to $1.84 trillion in 2017, with purchases from mobile devices (tablets and phones), becoming increasingly important (2). However, this growth in online retailing hides a problem with product returns. In the US, returns from traditional brick and mortar retailing are typically quoted as being 8 to 10% of sales, but returns from e-commerce are believed to be in the range of 20 to 30% (3, 4). European consumers display similar behaviour. Speaking to the Financial Times, retail data technology company Clear Returns suggested figures of 25% return rates for apparel by UK consumers and a massive 75% return rate by German customers (5)
A Growing Problem in online returns
Most retail businesses are exploiting online platforms to increase sales and meet customer expectations. They are also offering free delivery and free returns, which are shown to be drivers of increasing online sales. For example, Bower and Maxham (6) found that customers having to pay for returns decreased their subsequent spending with the same retailer by 75 -100% by the end of 2 years, whereas customers who had free returns increased their spending by 158 - 457%. The importance of free returns was also highlighted in a 2018 report from KPMG (7) that found that 67% of online customers expected free returns, which is a 5% increase in comparison with 2016 and 2017. Allowing customers to return products through a variety of different routes is also perceived to drive customer satisfaction. Buying online and returning in store is one of the most popular offerings. For some retailers, this offers an opportunity for spontaneous additional sales (8). In this project, one store manager stated that almost every customer that comes into the store to make a return would walk out having bought something else. However, the downside has been the unanticipated number of returns generated by online sales and the cost of this – few online businesses appear to generate the same level of profit as bricks and mortar retail. Furthermore, very few businesses appear to have a deep understanding of how and why these levels of returns, and their cost, are occurring. In 2015 The Retail Equation (9) reported that:
“Of the 10 retail clients under study, all were found to be underestimating their return rate – one by as much as 150 percent, with an average return rate discrepancy of over 80 percent …resulting in additional costs of over $462 million to a retailer doing $10 billion in annual revenue.”
Another study finds that:
“Companies would not make a product that costs more to produce, deliver and sell than it generates in income, yet they often spend more in processing the product in returns than it will generate in the end” (10).
Optimising their returns strategy is crucial for companies to maximise their profitability (8).
And furthermore:
“For eCommerce companies, an astonishing 14% of returns have been found to be fraudulent. This shows that whilst generous returns policies are important for customer satisfaction, it is important for company profitability to make returns barriers high, and be tough in enforcing them” (11).
Multichannel operation has created specific customer behaviours on a scale that was not anticipated. As shown above, free or low-cost deliveries have become expected (6, 7) and have been found to increase online sales. Similarly, free or low-cost returns and the choice available online have increased the level of returns. 2016 research by KPMG (12) showed that 91% of all product returns were free to the customer, whilst their later work in 2018 found that 67% of online customers expected free returns, a 5% increase in comparison with 2016 and 2017 (7). The evidence shows that returns from online shopping are high and increasing (13). In addition to the costs associated with processing returns (e.g. transportation, storage and order processing), there is a potential for increased losses due to damage of items and abuse of returns systems, through practices such as ‘wardrobing’ (using a product before returning it for a full refund) and receipt fraud (14). The cost of returns for manufacturers has been reported as between 9% and 15% of total revenue (15), while in the US, the cost of returns to both manufacturers and retailers has been estimated as $100 billion, in terms of lost sales, transportation, handling and disposal (16).
What does it mean for organisations?
Solutions that improve profitability and deliver high quality customer service are complex. Businesses need to consider reverse logistics, conservation of value, tracking of goods, processing time, internal and external fraud, customer brand perception, corporate social responsibility and sustainability. Too often organisations are ‘fire-fighting’ the problem rather than managing it through a strategic plan to deliver value from returns. This is exacerbated by the lack of data and clear handle on the true cost of returns to the business in many companies. We investigated what businesses are doing to manage the issues involved and what is needed to bring about the aspiration of seamless, low-cost omnichannel retail. We focus on customer returns (1) , and specifically returns within multi- and omnichannel retailing, where products are purchased online, but returned to store. As returns processes from all channels are often interrelated, we also evaluate other sales and returns pathways as required to build insight into the overall returns experience. We asked the following questions:
- What are the key costs, challenges and unintended consequences in ‘Buy Online, Return in Store’ returns processing
- What are the consequences to businesses if these problems are not addressed?
- What is the likely cost of product returns to the business and how can we use this information to improve profitability for the business overall?
- What does current ‘best practice’ for returns look like?
- What opportunities are there to improve returns processes and systems for retailers and customers?
(1) Reverse product flows originating from other points in the manufacturing and supply chain are out of scope.
How we carried out the research
The research was carried out in five phases:
The 5 Research Phases
1. Desk review of company returns policies.
- 79 websites reviewed Multiple options (in-store, post, courier).
- Free returns commonplace, especially for in-store.
- Return to store offered by 61 companies (81%).
- Some restrictions on in-store returns (e.g. size of parcels, type of store).
2. Qualitative Case Studies.
- 4 large companies; annual sales €10 – 55 billion 2015/16.
- Interviews. 25 participants - finance, loss prevention, store & distribution centre management.
- Observations: stores & returns centres.
- Process mapping.
- Thematic analysis.
- Development of returns cost calculator.
3. Structured interviews.
- 17 interviews (telephone, face-to-face, email).
- Elaboration of issues and practicalities elicited in case studies.
4. Community Feedback.
- Presentation of interim findings at ECR Shrink & OSA and ORIS Forums events.
- Generation of further insights and applicability of findings across the retail sector.
5. Returns Cost Calculator.
- Further work with 2 of the case study organisations.
- Further development of cost calculator.
The first stage of the project involved the identification of European retailers who offer customers a multi or omnichannel shopping experience. The websites of 100 retailers in 9 European markets, across a wide spectrum of product categories (grocery, general merchandise, home electricals and electronics, toys, apparel, Do-it-Yourself, sports goods etc.), were then reviewed for information on both delivery options and product returns, looking at the top line information given to customers and detailed returns policies. In addition, industry publications and academic literature was reviewed to gather existing data on the rate and cost of product returns.
Following this desk-based research, we carried out four detailed case studies, involving member companies of the ECR Community Shrinkage and On-Shelf Availability Group. The case study companies were major UK based retailers, with annual sales ranging from €10 to €55 billion for the financial year 2015/16.
Each of these companies retail a wide range of products, including groceries, clothing and general merchandise products such as home entertainment and small electrical goods. This research focuses on the processes and management of the return of general merchandise (non-food products), primarily apparel, small electricals and homeware (e.g. soft furnishings, bedding).
We visited stores, company headquarters and distribution / returns centres (RCs) interviewing 25 members of staff across the 4 organisations, with responsibilities in finance, loss prevention, store and distribution centre management. We studied the returns process in store - from the perspective of the customer and staff, both at the till or returns desk and ‘back of shop’ – and at returns centres. This enabled us to map the various routes of returns in each organisation and to develop insights into good practices and challenges facing the industry.
The case studies offer an in-depth understanding of a small number of companies, so it is important to test findings against a broader range of organisations. This was accomplished by conducting 17 short, structured interviews with other retailers, together with roundtable discussions and interactive surveys with retailers attending ECR Shrink and OSA events in 2017 and early 2018, plus the ORIS Forums Risk Summit in Spring 2018.
Telephone interview company characteristics
- Dominant Retail Format: “Bricks and Mortar” outlets dominated for 16/17 (94%) of companies interviewed.
- Business Size: 16/17 companies were classified as large businesses (>250 staff, >£30 million turnover).
- National or International?: Internet sales were focused nationally (rather than cross border) for 16/17 companies.
Finally, a specific strand of work was carried out studying the cost of product returns. A cost calculator was developed based on the findings of the case studies and structured interviews. This was further developed following detailed review with case study companies 2 and 4.

What we saw as key problems of ecommerce returns
We identified four major problems that ‘Buy Online, Return in Store’ has brought to light in businesses:
- Lack of understanding of costs and losses in ‘Buy Online, Return in Store’ (Section 3.1)
- The growing complexity of systems and processes and the difficulties in achieving integration (Section 3.2).
- Balancing the aims and objectives of marketing, sales, operations and finance in a ‘customer first’ culture (Section 3.3).
- Finding an organisational structure that can keep pace with growing issues (Section 3.4).
Lack of an understanding on ecommerce costs and losses in ‘Buy Online, Return in Store’ model
The fundamental issue is that none of the retailers in our study had a clear idea what the cost of returns was to their business. Finding the right data at the right place at the right time and turning it into useful information for managing the problem absorbs a significant amount of staff time. We looked at the different factors involved and why it was so difficult in some cases to reconcile the data and analyse the issues. In particular, we identify that there are additional costs in running ‘Buy Online, Return in Store’, increases in existing identified losses and additional losses that arise as a consequence of ‘Buy Online, Return in Store’.
Understanding costs and losses is critical
Staff on the ground can see returns escalating, costs increasing and the number of losses from fraud increasing. However, it is difficult to argue for investment in making systems more efficient and coherent when information such as the rate of return, the cost of handling a return and the relationship with net margin are not readily available. The main issues here are a lack of coherent data and the difficulties encountered in reconciling refunds and returns.
Knowing how ‘Buy Online, Return in Store’ impacts the bottom line
When it came to reports about the costs of returns and losses from increased fraud and shrinkage attributable to ‘Buy Online, Return in Store’ (or to online returns as a whole), we found that few organisations were able to call up the relevant information. Similar findings were reported from the USA in 2018 (17):
“Regardless of who handles returns, a surprising 39% of respondents said they have no visibility into returns—they just show up. A similar number (38%) receive scheduled reports and 32% track point of sale information at their returns center. More surprising, 40% of respondents couldn’t determine how much reverse logistics is saving their company and another 36% aren’t sure. Only 24% said they were able to determine how much their reverse logistics operation is saving their company, with an estimated average annual revenue savings of 16.5%.”
On top of this, there are other reported issues that give an insight into why making a profit on online sales is proving difficult. In their annual report for 2018, Next plc (18) state that:
“Looking at last year’s numbers it appears that every Pound of full price sales lost in Retail cost us 60p whilst every Pound gained Online delivered only 19p of profit. This margin erosion is partly a result of the shift in sales from Retail to Online. Retail carries large fixed costs (such as rent, rates and energy) which, in the short term, are unable to contract with reducing sales. On the other hand, the Online business has significant variable costs which increase with sales (delivery, warehouse picking, returns processing, call centre activity etc.).”
‘Buy Online, Return in Store’ is likely then to suffer both issues: the high overhead of stores plus the significant variable costs of online.
Although returns are a variable cost in terms of the number of items returned, the size or cost of the item has very little impact on the cost of returns. This is logical enough, as the number of staff members required and the amount of infrastructure such as cages, transport and space for a pallet, box or skip, remain roughly the same regardless of the nature of the item returned (with the exception of very large items). Reducing costs for very small and low-cost items by either not taking the return (where the amount lost processing the return exceeds the amount lost on resale at full cost), or minimising the returns process for small items, makes sense and is well established. This is, however, not cost-free as the administration, postage etc. are still needed.
Best practice to tracking costs, losses and cost of returns is, wherever possible, to create clear links between the item being returned, the customer and the item’s pathway through the returns process back into sale or into another exit route. Examples of the additional costs and losses arising from ‘Buy Online, Return in Store’ are shown in Figure 3 below.
Most interviewees explained that it is difficult to get investment in returns systems approved, as benefits in terms of improved income (rather than profits) are seen as small against overall sales and not in line with customer growth. However, investments in making internal systems more detailed and customer portals more accessible were reported. Investments in better cages for transportation between store and distribution centre, and in handheld devices, are shown to pay off.
We found that those organisations that treat returns as a separate profit centre and returned items as assets on which cash flows could be generated also experienced the most gains in improved profitability for the organisation as a whole. One reason for this is that they have several income-generating routes for exit and can maximise income from returned items. However, they still experienced concerns over lack of data and reconciliation issues to achieve this end.
Examples of Costs and Losses from ‘Buy Online, Return in Store’
Additional costs from “Buy Online, Return in Store”
- Incremental IT development, maintenance and support costs.
- Additional costs of new handheld and desk-top devices.
- Incremental cost of financing staff to manage monitoring, reconciliation and reporting tasks.
- Security and storage of items in store as usually requires more than a spare space.
- Wrap and packaging for goods not resold in store.
- Transportation for goods not for resale in store.
- Additional staff costs in busy periods.
- Opportunity costs of staff engaged in returns rather than other forms of customer service leading to sales.
- Costs of running a returns receiving and distribution centre.
- Costs of repair and repackaging for damaged items.
Increased losses from “Buy Online, Return in Store”
- Increases write offs of goods that are not re-sellable in store or online.
- Increased incidents of internal theft.
- Increased claims for refunds where claimed not to have been received.
Consequential losses from “Buy Online, Return in Store”
- Goods lost or damaged in transit.
- Goods sent to recycling or jobbing that could have been re-sold in store or online.
- Goodwill payments and card recharge payments arising from items lost in transit or from fraudulent claims of being lost in transit.
A lack of coherent data
The organisations that we visited used the returns data that they did have to fulfil particular monitoring and evaluation routines. The numbers of returns to store or other route, refunds made, and reason codes are systematically monitored on a weekly basis and disseminated to loss prevention and other staff for control purposes. These include identifying which items are less successful and generate more returns, in order to identify root causes and improve performance. However, a significant amount of an accountant’s time is also given to attempts to reconcile unmatched refunds and returns. This task increases where customers have the option to checkout online as a guest rather set up a personal account on the retailer’s system. A further focussed approach uses data mining techniques to identify potential fraud and habitual returners, which does produce results in terms of prosecutions for theft.
We were unable to get a clear idea of the transaction cost figure for returns calculated by the studied companies. Only 3 of the interviewees were certain that one existed but could not say what it was or how it was calculated. Without a transaction cost figure, it is very difficult to ascertain the true cost of returns. Furthermore, there is a wide variation in the minimum value of items that are automatically written off, ranging from €3 up to €85.
Interviewees were more confident about their rate of return figures but again, interviewees were often not sure how these were calculated or admitted that they did not have sufficient information, due to reconciliation problems, to be able to say what the rate was for the online business. We were given figures of between 1% and 20% by most interviewees, although one company claimed a rate of 75%.
There are several definitions used for stock loss, and losses due to returns are not always separated out. In addition, few companies separated out losses due to their online business from those originating from their stores.
This has the knock-on effect that performance measurement metrics and targets for selling, call centres and loss prevention teams are not in alignment. For example, to meet customer service requirements, the call centre may give more goodwill payments to customers than budgeted for and this conflicts with the loss reduction aims of loss prevention teams.
Reconciliation issues
When reconciling stock loss figures, the biggest issue was matching refunds made with items returned. Although this was a problem reported at all sites we visited, it was particularly an issue where the online business was a separate business unit but stores were not connected in real time to the systems of the online business and/or customers had the facility to use a ‘drop-box’. Lags in matching data from the system to the item and phantom losses where journal entries were made that did not match refunds to the corresponding returned item contribute to the problem.
One point of contention for those managing the reconciliation process is the perceived emphasis on increasing sales through making returns free and giving as many ways to return items as possible. Whilst free returns are needed to remain competitive, liberalising the modes of return risks increasing the rate of return beyond what is desirable. Similarly, a high level of goodwill payment and non-denial of refund, particularly where the payment is made in advance of the returned items being received, are designed to retain customers. This may be based on thinking that is not supported by research into customer behaviour. For example, in The Retail Equation’s report ‘Return Fraud and Abuse: How to protect profits’ (19) they discovered that:
“The final question retailers pose is: “What happens to a consumer’s shopping behavior following a denial?” Using a controlled sample that analyzed shopping patterns before and after a denial on the same consumers, we found two significant facts: The shopping patterns of 35 to 40 percent of consumers who experience a return denial are not affected afterward.
Within 60 days of a denial, on average, net sales for all denied consumers resume their pre-denial levels. Thus, while denying a consumer may generate some short-term effects, eventually the consumer is rehabilitated into a more profitable consumer, which is the desired end result.”
For ‘Buy Online, Return in Store’ scenarios, another point of contention is that the loss is not logged against the online business but against the store. Further friction with supervisory staff occurs when the item is processed correctly in store but the loss occurs in transit or at the distribution centre, for example, or where the full amount of the cost of the item is charged to the store for an item currently on sale at a discount. Additionally, as the item was returned in store, there is the risk that staff there will resent being seen to be responsible for losses they had no control over. There is a need for businesses to incentivise loss reduction / profit enhancement in store, and to find ways to ensure that online sales returns are charged to the online business centre. Better systems use control accounts to offset costs and refunds. A related issue concerns ensuring refunds due from suppliers are obtained. RCs report varying degrees of success in ensuring that contract terms and conditions with suppliers include clear instructions and compensation for returned items. Where goods can be returned to suppliers, this provides an income stream that offsets losses. Some sites admit that this route is not being used as well as it could be. Even when a rebate was possible, items were not always identified in the distribution centre for return to the supplier, and this opportunity for income was lost. In particular, a corresponding instruction needs to be built into the computer system used by those assessing and classifying the returned items in the RCs.
Case example: the need to understand why people return products
A lack of accurate data on return reasons means missed opportunities to improve practices in the organisation and to receive income from suppliers. This is found in several studies, including one on electronics (20):
“In consumer electronics companies, only 30% of returns costs were accounted for as warranty costs, whereas the remaining 70% were logged as ‘selling, general & administrative costs’ or as part of operational overhead…95% of returns are unrelated to product defects.”
The level and granularity of data collected varies considerably across organisations. In our research, some organisations claimed to collect no data on the reason for customer returns, whilst the most complex system (dealing with the return of fresh foods as well as general merchandise) lists 58 return codes. One organisation offers a “quick, no quibbles” returns process - staff do not question the reason for return provided a receipt (for in-store purchases) or delivery note (for online purchases) is provided. Three code categories cover up to 99% of returns:
- Change of mind.
- Wrong size / colour etc. (this can also include the return of products which were incorrectly picked, i.e. the wrong product was supplied).
- Faulty / damaged.
Faulty’ (due to a manufacturing problem) and ‘damaged’ (in the supply chain or by the customer) are distinct issues but customers appear to use these terms interchangeably. This affects claims for a refund from the supplier:
“Well if an item is faulty or damaged we then need to rectify that issue of the product when we take it back, so we need to press damaged or faulty [on the till menu] because it then prints out a second receipt, which we have to fill in, to either get the money back from that company, from say sale or return items, or sort of send it off to our national returns centre to either adjust the price if it’s still sellable, or if it’s too brand damaging to be able to sell, we would then write off that…” (Shrink team member, Company 4) .
Reasons for Returns
The majority of respondents believe that understanding the reason for a customer return is important for three reasons:
(i) To improve the customer experience (e.g. to identify if a product has been poorly described on-line).
(ii) To be able to identify poor buying decisions and to improve learning.
(iii) To access refunds from manufacturers, e.g. where refunds are given for faulty products, or to trigger decisions about price reductions before resale or product write-offs etc.
Whether extensive lists of return codes are useful is debated. More detailed returns information might be required to enable a retailer to understand if, for example, a consumer simply disliked the colour of a product, or if an online photo or description of a product was inaccurate. On the other hand, customers and staff can default to the simplest option (‘change of mind’). Many participants claimed that customers often failed to complete this section of returns notes for products purchased online - as one participant admitted:
“[we have to] hope that the customer wrote on the label why they’re returning something, which I never do when I return something, it’s not surprising that our customers aren’t doing it for us” (Finance team member, Company 3).
One of the challenges for part-time and temporary staff in particular is understanding long lists of codes, with fine nuances between different reasons. Also, using ‘change of mind’ avoids the need to question the customer in detail and shortens the returns process. This code often appears at the top of the pop-up list in the returns system. Company 3 said that up to 70% of its returns are tagged as such.
Online sales give rise to a further problem. Customers order more than one size or colour of an item, encouraged by free shipping and returns, expecting to return items: a 2018 report from shopifyplus (21) found that 41% of ecommerce shoppers buy the same item in multiple sizes or variations with the intent to return all but one or two. ‘Change of mind’ is not adequate to capture the actual reason for these returns. It also does not cover the behaviour of effectively “renting” items – TVs purchased just before and returned just after a football tournament for example. One participant of the structured interviews (TP6) described how customers use the category of ‘faulty’ to hide this practice of ‘wardrobing’, using the example of lawnmowers returned at the end of summer. When tested, around 70% were not faulty at all. Staff in store cannot check the truthfulness of customer statements, and even when products are checked at a dedicated RC, it might be argued that faults are intermittent etc. Such returns are difficult to challenge, particularly when good customer service, rather than cost control, is seen as a priority.
The representativeness of the data is also in doubt, whether completed by customers or staff members:
“…there’s a lot of manual intervention in the data that we don’t really believe to be true.” (Finance team member, Company 3)
Interviewees also explained that even where reason code data is collected, the data might not be systematically collated and disseminated across the organisation. Opportunities are lost for identifying fraud and poor buying decisions:
“…we’re probably looking at returns codes to see if there are customers or staff, individuals exploiting us in some way. So, also, we look at returns codes to understand what the impact to our shrinkage pots would be …” (Loss team member, Company 4).
The same team also highlighted the potential for the data to be used by buying teams to inform decisions about stock selection:
“…you’ll have the returns team looking at it [reason codes], or even the buying groups looking at it and saying, oh we keep having this product as faulty, you know, is this product we should continue to sell? So there are different reason codes that different people would be interested.” (Loss team member, Company 4)
However, they recognised that the data is a relatively ‘blunt tool’ to inform such decisions:
“…the way our reason codes work is, all a buyer would be able to see is that was faulty, or it was damaged. They wouldn’t be able to see ‘the jeans fell apart in wash’, or it was the wrong size …” (Loss team member, Company 4)
In ‘Click and Collect’, non-collection of orders is classed as a return. A member of the returns team in Company 4 explained:
“.. so what happens is, you buy something on ‘Click and Collect’, you don’t pick it up, for whatever reason you don’t pick it up, “… I just can’t be bothered to pick that up, I know I’ll get a refund for it eventually”. So what it happens is, you’ve never had it, you’ve never had it in your hand, you’ve never made a conscious effort to ever, ever take it, it goes back to our returns centre and we refund you. Now that’s considered a return, even though you physically never took it away, and didn’t return it. …so that’s a sort of fictitious return…” (Returns team member, Company 4)
The products have never left the control of the company but the physical transportation and processing out of and back into inventory builds up costs for the organisation. Potential sales are lost whilst the item is waiting to be collected.
We found that each area of the ‘Buy Online, Return in Store’ process revealed similar stories of potentially inaccurate and difficult to analyse data. The more the demand for online grows, the greater the problem is likely to become, unless organisations can get a handle on their data, costs, and losses. In order to be knowledgeable about how to make the business a truly omnichannel experience, we suggest that the returns process is managed as a profit centre and monitored from board level. This would require that data is aligned and that performance in terms of improvements to the bottom line is measured with more confidence. Creating these systems for returns would provide a focus that could deliver benefits for the whole business and its customers in terms of better decision making and increased resources, as illustrated in the next Figure.
Sometimes data is not processed to form information, and information is not synthesised to form knowledge, which is essential to be able to create improvement.

Complexity and disintegration of systems and processes
It appears that most organisations start with their online businesses as ‘standalone’ operations, separate from the in-store business, i.e. they operate as a multichannel business, both in terms of the customer proposition and the ‘behind-the-scenes’ business organisation. Whilst some companies make no further moves to integrate their businesses, others transition to an omnichannel operation, offering a seamless shopping experience to the customer and merging their business operations. Both choices are valid and can function efficiently. However, the majority of companies are trapped somewhere in the transition from a multi- to omnichannel proposition and hence struggle with their systems’ patchy integration.
“… although we work in an omnichannel world, a lot of our systems were designed to be single channel and we’ve made them work omni … the most difficult thing I think, ‘cos you’re changing all the time to be responsive, but it’s difficult to keep all the systems in tune.” (Returns Director, Company 4)
The stepwise development of the multi- and omnichannel environments has led to the interaction of multiple systems that are often not designed to interact. Consequences include multiple - and often partially manual - processing of information, with information not travelling to the right places at a useful speed as systems are not communicating effectively. This problem affects:
- Financial systems.
- IT systems.
- Scanning systems.
- Data entry
- Inventory control.
System Integration
The underlying issue is making sure that systems can talk to each other in near real-time, which is needed to ensure that transactions and inventory can be fully reconciled, and that the business and its customers have reliable information on their accounts. The level of investment to achieve this can be seen as a secondary priority or at worst, excessive against the benefits achievable.
This results in duplication of effort and the potential for errors in processes, tracking of goods and costs. For example, in Company 4 returns of online purchases can be processed at any till point. In-store purchase receipts can be scanned at the till point, generating information on the specific sale but it is not possible to scan delivery notes for online purchases. Instead, staff physically enter invoice details to bring up the sales and enable returns to be processed. The online and in-store systems are not fully integrated. This may not have a direct impact on the customer (although the returns process might be slowed down), but staff need to be trained in two different processes, which increases the possibility of errors being made.
Complexity and duplication of effort was also seen at the company’s central RC. Returned items are examined and the delivery note scanned to show receipt into stock, but if a customer refund is still required, a separate system is used to trigger the payment. The lack of integration of systems was recognised as another potential source of errors:

“Process errors have significantly increased as we’ve become a much more complex business …. our systems are old, they’re like a patchwork blanket, lots of different old systems that are being replaced very gently and carefully because we don’t want everything to fall down at all, they’re inter-linked…” (Loss prevention team member, Company 4)
A slightly different situation arose in Company 2. Here, in large stores, three different till systems were available. Online returns could be processed on all three systems, but different data was captured by the different systems, increasing the complexity of tracing and matching returned products and refunds.
Company 1 also recognised that challenges with the integration of systems had the potential to create errors or anomalies in data, in this case anomalies in data between stock levels and financial systems:
“ …the systems will generate figures, and the way we’ve got some of the distribution set up at the moment causes some quite interesting figures, where it looks like we’re losing millions out of DCs but we’re gaining in another area of the business … we’ve got some legacy distribution systems and they can’t talk to one another …” (Loss prevention team member, Company 1)
There are similar complexities in paying refunds for items bought online. Some companies offer refunds in store, whilst others have a central refund process (triggered either by the receipt of products at the RC or by receipt into store stock). However, for all organisations, purchases made using PayPal offered particular challenges. None of the organisations we spoke to offered refunds in store where customers had used PayPal and additional process steps were required to generate the refunds. PayPal returns were seen as complex and cumbersome and were highly disliked by store staff. A more detailed cost-benefit analysis would be required for the individual organisations to judge whether the benefits of accepting PayPal sales outweigh the complexities and costs of processing returns for these sales.
The intermingling of electronic and manual, paper-based systems, also poses challenges. In general, on the return of a product to store, a series of paper documents are generated, for the customer (to document the physical return of the product and / or the payment of the refund) and for the business, to ‘tag’ the product and identify it for its return into stock. In the case of Company 2, although electronic systems were used to scan the product into the stock receiving area in store, and to trace their placement into secure cages for return to the RC, staff in one busy store we visited kept a separate, paper-based list of all returns as a backup system. They also used their back up system to chase up store credits for returned stock, as there had been issues with the official system in the past. In Company 4 the manual systems were particularly complex as they were used to deal with receipt into store stock, to identify products for return to the RC and to identify products for return to vendors on a sale or return basis.
As well as several routes for customers to return items, there are several ‘exit’ routes used for the returns. The most complex process occurs where goods are returned to medium- to large-sized stores. Goods may be placed back on sale in the store at full or reduced price (occasionally after minor repair in store e.g. replacing a button, minor cleaning) or sent to a return centre (RC) (in-house or outsourced)(2) .
At the RC, decisions are made to put items back into stock at full or reduced price (for sale online or in store); return to the manufacturer; send for repair (to the manufacturer or alternate site); send for recycling; send to waste or send to charity (where agreements exist). In many organisations, use is made of ‘jobbers’, middlemen who purchase goods in bulk, at a reduced price, from the retailers. They may then resell the products (perhaps after further processing or repair); recycle the products; send products to charity or to waste. One issue for sustainable practices is knowing what the jobbers do with the items they buy. Few organisations monitored the items to final destination, except to ensure that the items are not sold in direct competition to themselves.
How the decision is made as to which exit route to use varies between companies. In Company 3, the handheld scanners used to check in product returns direct staff as to whether products should be kept in store for sale or sent to the RC. In other companies, these decisions rest with the store staff and management. In Company 4, in particular, staff appeared to have a degree of autonomy to maximise the value of returns, e.g. by making small repairs in store. Products might also be transferred between stores – with, occasionally, staff or their family members acting as couriers – to facilitate the return of products to stock.
Complex returns pathways mean that staff do not always choose the one that is most cost-effective. This is because the guidance and directions they are given on screen and the discretion they have might, for example, lead to an item being jobbed when it could be returned and sold at a discount, or a supplier refund being missed.
(2) In some cases, stores directly return products to manufacturers (e.g. sale or return goods), distribute them to charity, or send to waste or recycling. However, these exit routes are most often managed centrally at the RC.
The cost and time taken to return products to stock (or not) is critical if any business is to optimise their product returns systems, maximise income from returns and reduce losses. Whatever the returns route, the combination of e-retailing and returns lead organisations to hold an increased total inventory to compensate for products being held at various stages of the sales and return processes. This means more capital is blocked, and the risk of more products becoming obsolete or damaged before sale is greater.
The Unintended Consequences of a ‘Customer First’ Culture
A key finding across all of the case study organisations, supported by discussions with other members of the ECR Community, is the impact of a culture of ‘customer first’ or ‘superior customer service’ on the processing and management of product returns. Couriers, post, third-party collection hubs such as Collect Plus, and return to store – including the provision of drop boxes - are all now routinely offered as return options for customers.
All retail organisations share this aim. As one said:
“…generally we’re here to believe in the customer, try and act in their interest, because we put ourselves into their shoes, how do we want to be treated…” (Loss prevention manager, Company 2)
Similarly, a staff member at Company 4, pinned down the problem, saying:
“…forget profit protection / loss prevention from this point of view, the lens that the business is looking at is really from a customer service point of view…” (Loss prevention team member, Company 4)
It is well known that free delivery positively impacts customers’ decisions to buy products online (22). When free delivery is combined with free product returns, it can drive customers to order additional products which they have no intention of keeping. KPMG (23) found that 35% of women’s fashion online purchases were intentional returns. Furthermore, by claiming the most expensive product is faulty or damaged customers not only get the benefit from free delivery and return products at no cost to themselves but may also receive a ‘goodwill’ compensation payment for inconvenience.
This causes very real tensions between the customer service teams and other parts of the business such as loss prevention teams and finance, even more so because all of these believe in the ‘customer first’ approach. In one organisation we were told:
“… there’s a different set of goals as well, so at the [call centre] the primary role is to keep the customer happy, deal with them and get them off the phone quite quickly, whereas we’re saying actually you need to do that but you also need to make sure that you’re not costing [the organisation] too much.” (Finance manager, company 2)
‘Customer First’ Culture
Businesses are faced with the dilemma of offering high levels of customer service at the same time as mitigating losses from customer transactions. There are internal conflicts between the aims of customer service teams and loss prevention teams, especially in terms of getting accurate data to distinguish between the cost of returns as a customer service and the losses made from shrinkage, theft and fraud.
But then another member of the same team explained further:
“… from our returns point of view that says, our strap-line statement is zero cost of returns, try and break even, but not at the expense of the customer experience … give them a money card if needs be, really quick service just to recover that customer.” (Finance team member, Company 2).
In another case company, the team identified a ‘snowballing’ issue with giving refunds:
“… it’s a think yes first mentality, where you believe the customer is genuine in their refund ... that’s given lots of staff the okay to give a refund even when they’re a bit suspicious, they’re thinking it’s okay to do it ‘cos I can just say it’s under [our mission]. And I hear that a huge amount where they say under [our mission] they did the refund, or they gave the credit voucher, and they price corrected the credit voucher, or the credit voucher was out-of-date and we still took it, or something like that, and they just say it’s under [our mission] we did it, ‘cos noone wants to be picked up for giving bad customer service and being anti-[our mission].” (Loss prevention manager, Company 1)
How do you get the balance between giving customer satisfaction and effectively giving away free gifts to customers? Asdecker et al. (24) investigated this and concluded that the composition of the customer’s shopping basket is the bigger influence on the returns rate. More ordered items do not necessarily lead to more returned items: multiple items of different colours are less likely to be returned than multiple items of different sizes and styles. In addition, coupons do increase returns rates but other freebies may not, particularly if customers have a bad conscience about returning all the items and keeping the free gift. Allowing payment on invoice rather than at point of sale also increased returns rates in their study of one clothing company. Getting the balance right seems to be a difficult exercise.
A key impact of the ‘customer first’ culture is seen in the return to store scenario, where actual practice can be in conflict with official returns policies. All retailers have comprehensive returns policies, generally setting out both a time limit for product returns and requiring a proof of purchase in terms of a product receipt for in store sales or a delivery note (paper or electronic copy) for Internet purchases (3) . However, the drive to place the ‘customer first’ often means that front line staff ‘bend the rules’ in accepting returns. A speedy transaction is perceived as good customer service by all parties.
One example of this, which had practical and financial implications for the company concerned, was seen when we visited a store at Company 2, where staff had accepted the return to store of a 163 cm screen TV. Such large electrical items should, under the company policy, only be returned via courier, there being both health and safety implications (for staff lifting such large products) and in the safe storage and transportation of products back to an RC. As the item did not fit into a transportation cage, the opportunity for resale or return under warranty was delayed. There was a significant risk that the item would be damaged during transportation and the full value of the product lost. Across all the case study companies, staff are reluctant to refuse items brought into store for return, because of the genuine desire to meet customers’ expectations for good service.
(3) Such policies are developed in line with any legal requirement for the return of products e.g. UK Consumer Rights Act, 2015.
A similar situation arises where customer returns are handled by customer service centres. Company 3 describe the issue of refunds being given by customer services before goods were received back into stock (and often supplemented by gift card goodwill payments), because of the culture of putting the ‘customer first’. As one finance manager said:
“… there isn’t really an easy way for a customer to get a refund if we don’t have the product. To do it, a colleague in the contact centre needs have a product, an order number to log into a system, process it and give them it back, so all of our stock loss must be coming from contact centre refunding customers on good faith.” (Finance manager, Company 3)
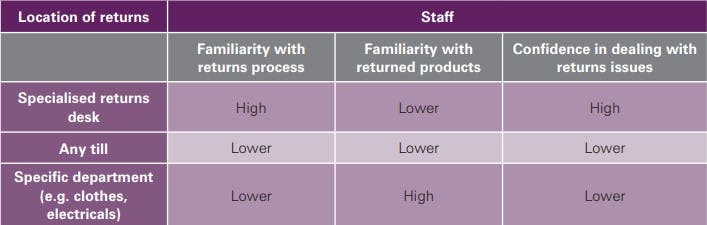
‘Customer first’ policies have also been one of the driving factors in the decision on where in store returns are handled. Although seemingly simple, this decision is strategic, with consequences on service level and returns fraud prevention. Table 1 shows some potential implications of the returns location in store.
Processing returns at any till may initially appear to have a positive impact on customer service, as being the quickest route for customers. However, the lack of specialised knowledge of both products and the returns process may not only increase the risk of customer fraud and reduce the quality of returns data being collected, but in fact may negatively impact customer service if staff take more time to process returns due to lack of familiarity with systems or having to consult with other members of staff (e.g. with supervisors to advise on returns policy information).
Table 1: Implications on location of returns in store
‘Customer First’ itself is difficult to argue against as a policy but it is costly and has unintended consequences when it comes to returns. In particular, companies need to invest resources to identify and prevent intentional abuse of free delivery and returns policies to control costs.
Organisational Structures
Most teams are just getting to grips with the size of the problem that ‘Buy Online, Return in Store’ (or return elsewhere) is causing. A coherent, integrated approach across the organisation, going from top to bottom is needed to have an effective and efficient response.
Organisational structures keeping pace with growing issues
The organisations that have made the closest transition to being able to control and monitor their online businesses had evolved from those that had an effective mail order business before the Internet became so dominant. They have executive managers with specific responsibility for the reverse supply chain and multifunctional teams tackling the problems that occur. However, only one telephone interview organisation appeared to be at this stage. In all the others, returns, the costs associated with them and the increasing losses were still emerging as a day-to-day or operational issue rather than a strategic one.
The signs that this is the case for many retailers is the perception that was reported to us that the costs and losses from returns were a very small amount in relation to sales and other costs. They are believed to be simply a ‘negligible’ cost of doing business. However, at least two of the loss prevention teams that we spoke to in our case studies were working on educating their management about the impact on net margins – something that we explore later in this report when we look at calculating the cost of returns. A number of smaller businesses have found that the cost of returns has made their online business unviable. Even major retailers are not immune: the closure of Tesco Direct in 2018 was attributed by the company to the high costs of order fulfilment and online marketing (25), but with typical return rates of over 20% across the industry, the cost of returns is likely to have been a contributory factor to this.
Thinking in absolute terms about the costs involved can distort the picture. We contend that the business that thinks more holistically about improving net margins through a thought out reverse logistics strategy is likely to see significant improvements in its bottom line. This is backed up by Sciarotta (26), who, writing for the Reverse Logistics Magazine states:
“(...) pioneering companies (…) identify (…) reverse logistics as more than what amounts to disaster remediation, and see it as a way to improve cost savings, customer satisfaction, profitability, environmental viability, and ultimately competitive advantage and profits.”
Yet when we were offered interviewees for the project, there did not seem to be a reverse logistics manager role, nor a senior executive role with clear responsibility for creating an integrated, omnichannel system for the online business and its returns. Therefore, it was difficult to get a sense of who was leading the company’s response to the growing issue of increasing returns through ‘Buy Online, Return in Store’. In one case, the loss prevention manager had carried out a review which culminated in a report to strategic management about the creation of an effective reverse supply chain, based on their experience in a previous organisation. This had led to plans which were still to be finalised for future operations. This lack of visibility to senior management seems to be common however: the Reverse Logistics article quoted above also states they found only 17% of companies with a department for reverse logistics.
The loss prevention teams worked with finance and stores to create reports which assisted buyers and store managers with the identification of product lines which experienced high levels of return. Digests of these reports were circulated upwards with the most significant and costly items being brought to the attention of senior management in regular meetings. Mostly, the reports were cascaded downwards to identify problems at store level. There were also reports based on KPIs and reconciliations for losses and returns which were prepared on weekly or other regular bases for circulation. Members of loss prevention teams dealing with fraud tended to work reactively to identify individuals with a view to prosecution. However, in at least one case they were using data mining and other techniques to identify trends and issues (such as the growing problem with loopholes being brought to wide attention via social media). These findings were being reported upward in an attempt to gain investment into fraud prevention.
All the organisations had effective reporting systems but noted that only very high-level information tended to make it to the top of the organisation. There were few examples of returns issues being reported at board level. The best practice we found was one case study organisation that translated its successes in reducing losses from returns in terms of shrinkage and unmatched refunds and returned items into the equivalent sales that would be needed to make the same impact on net margin – the bottom line. All struggled to convince buyers, marketing and customer service teams that investment into loss prevention systems in returns would make an impact. This suggests that few organisations yet have leadership and cross-functional teams in place to meet the challenges of running an omnichannel business. We were offered little evidence to suggest that such arrangements are in place.
In two of our case organisations and four of the telephone interview companies, the running of the regional RCs was outsourced to multi-national logistics companies. The third-party managers of these centres worked closely with the loss prevention team and logistics under a target cost contract (see Section 4.1 for more information). One case study company and its logistics partner were offering their return processing services to other companies. This generated a useful income stream but also added to the complexity of collecting returns in store and by other means. Staff were not only processing their own returns but those of other businesses as well. It was not clear if and to what extent these business relationships were profitable. No participant in the study had completely outsourced their returns, and this makes some sense in a customeroriented business. As at least one case study company put it, a customer returning an item in store often purchased another. There could be a loss of control in maintaining good customer relationships if the returns process was completely outsourced. However, there may be gains in outsourcing parts of the process.
No business that we spoke to had cross-functional teams managing the returns process, although there were examples of staff at operational level discussing issues across functional boundaries. The growing pressures on profit from online businesses and the surge in returns that they generate should be the catalyst for businesses to consider bringing together marketing, online sales, operations (including third party logistics providers), loss prevention and finance to find solutions that both increase profits and move the business towards being omnichannel. Responsibility for this should be assigned to senior management and monitored at board level. Otherwise, there is a risk that online returns exert a drag effect on the organisation in terms of logistics and profits. As Lambert and Enz (27) found in a 25-year study of supply chain management:
‘Collaborative initiatives conducted within cross-functional relationships led to higher profit contributions than relationships managed with a traditional salesperson to buyer approach’.
Research Insights and Long Term Aims
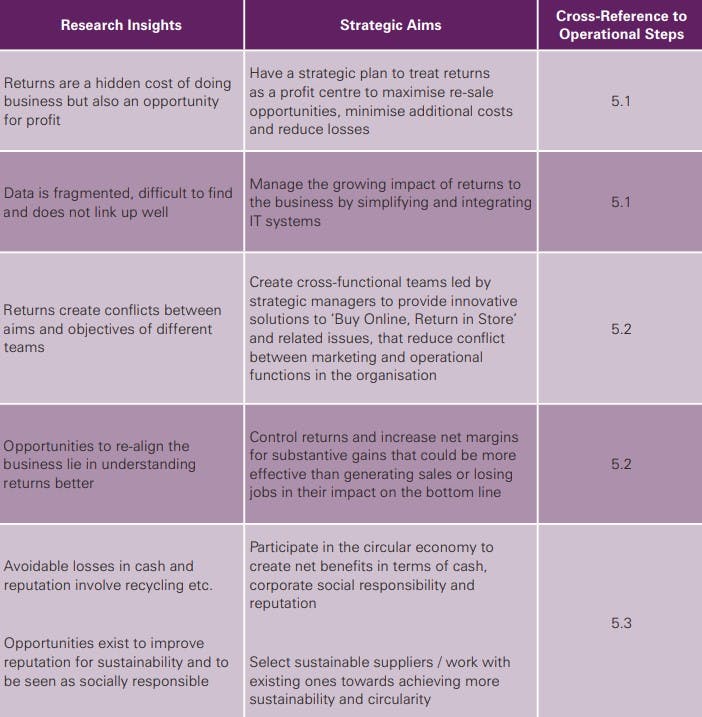
Table 2 summarises the research insights and long term aims that result from our findings. In Section 4, we look at the operational steps that managers can take to work towards these aims.
Table 2 Summary of strategic aims arising from our research
Challenges and unintended consequences
The problems identified in Section 3 have several unintended consequences. We group these under three headings that indicate where the fundamental effort needs to be directed by businesses if they wish to understand and develop their ‘Buy Online, Return in Store’ offerings. We give several examples of good practice in these areas from the case studies and interviews, as follows:
(i) Controlling the increasing costs of returns
(ii) Customer communications and unexpected complexities
(iii) Contributing to the circular economy and reducing the impact on the environment
Controlling the increasing cost of returns
There are challenges in calculating a cost of returns for a business. The value of trying to capture a cost of returns is acknowledged, especially in terms of getting the resources needed to control the processes. There are two methods of getting the necessary information to make decisions – an audit-based approach and a risk-based approach. Both have limitations and along with the lack of coherent data shown in Section 3, restrict the ability of the organisation to get visibility of the true cost of returns. Both approaches and their limitations are discussed here, along with suggestions of the better approach for decision-making to tackle the growing issues involved.
The audit-based approach
The underlying problem is the extent to which the costs of returns can be determined. As part of the community feedback sessions with the ECR Shrinkage and On-Shelf Availability group, we asked 23 loss prevention experts about the expectations of their organisation. In many cases, their managers want a full cost breakdown based on an audit of costs. Achieving this requires a significant amount of work extracting information from the different systems held in the organisation, many of which do not ‘talk’ to each other. The cost of transportation, of postage and packing, of RC costs and call centre costs, for example, are held in different IT ‘silos’ in the organisation.
Elsewhere, The Retail Equation (19) find that:
“Clearly, returns cause the retailer to lose the profit margin earned on the original sale. The monetary drain, however, does not end there. Additional losses accrue when you factor in the time employees spend processing returns, evaluating the item’s resale potential, and restocking the returns. When an item must be discounted or, even worse, discarded after a return, it further compounds the company’s losses. Then, of course, there are the administrative expenses of accounting for returns and managing the entire return system. For mass merchandisers and nationwide chains, the industry-wide costs can reach hundreds of millions of dollars annually. As a result of the aforementioned expenses, our experience indicates that an individual consumer with a long-term pattern of return rates greater than 20 to 30 percent negatively affects operating profit.”
An audit-based approach has the advantage of being based on actual data and produces an absolute cost of returns made. However, for decision-making, there is the issue that past performance may not be an accurate guide to future performance. Several periods of data are needed to provide trends and forecasts, and to provide evidence of savings. Also, the data can be difficult to manipulate for ‘what-if’ scenarios.
We found three organisations that achieve detailed records based on the returns made, the income derived from secondary sales and the impact of loss prevention exercises. However, they did not have a detailed breakdown of overhead costs relating to returns, as yet. One organisation was moving to an activity based costing system that should provide the information4 . A management accountant in another organisation was successfully but painstakingly constructing the audit trails needed to find all the costs that feed into the returns system. The organisation that is most successful at identifying costs is well-established, having previously been a mail-order firm. It has coherent systems and the stores are secondary to the online business. It is then easier to separate out online-related activities such as ‘return to store’ and allocate an overhead cost to the handling of returns.
The risk-based approach
The second approach to calculating the cost of returns is risk-based and uses probabilities. The advantage of this approach is that it provides a framework to carry out ‘what-if’ scenarios to identify the impact of initiatives. These could include initiatives that drive sales (for example, another route for return or free delivery) as well as those that aim to reduce returns (such as providing an interactive clothes fitting tutorial online). Examples of this approach can be found both in research and practice.
As mentioned above, the returns cost per item does not vary much in relation to the size, weight or cost of an item, only with the numbers, which is directly related to the rate of returns. Therefore, using an approach based on averages is valuable for ‘what-if’ scenarios.
This approach still requires data to be collected in order to get a handle on rates of return via individual routes and to find average transaction costs. An audit and benchmarking exercise is needed to ascertain these figures. However, the effort involved in producing robust proxy data for this analysis should pay off in terms of being able to illustrate the dynamics of returns, sales and impact on net margin. It has advantages for forecasting and for developing ‘what-if’ scenarios.
We have developed a model for capturing a cost of returns that can be used in decision-making for investment and to show the impact of returns policies on net margins in the returns process. It is an extension of a wellregarded model used in peer reviewed research publications and practitioner reports.
This model shows that the rate of returns significantly affects profitability. Sales might increase with some incentives for consumers, but the cost of returns is detrimental to net profits, particularly in multiple retailers where bottom line profit margins are typically well under 5% of sales. In theory, it is possible that the profit from increased sales will eventually be eliminated by the cost of returns. Whilst this may be unlikely in the scale of some tens of thousands of SKUs, it may happen for individual lines, business units or customers. Online sales are particularly vulnerable to this issue due to the higher level of returns experienced and the possible higher level of maintenance costs of the online system. However, we were not able to obtain clear costings for the latter, mainly because organisations do not yet derive the information from their systems.
Our model has three main purposes:
- To act as a checklist to identify what data you need to be capturing to get a cost of return.
- To highlight the impact of policies through what if scenarios in terms of impact on margin, equivalent sales and equivalent jobs.
- To provide ‘what-if’ scenarios for discussions with marketing, investment committees etc.
The Cost of Returns model is explained in Section 5.1.
Best practices in managing costs and losses
We did find other best practices in terms of initiatives to manage costs. For example, where organisations use a third-party warehouse operation for their RC, savings are reported where there is an open book arrangement between the firms. The contracts include additional payments for targets attained. The use of such target cost based contracts appears to be beneficial in these arrangements.
One organisation, in presentations to senior colleagues and others, converts the savings made through loss reduction into more tangible measures. For example, a reduction in losses equates to an increase in net (bottom line) profit. They calculate how many sales are needed to achieve the same increase in net profit. Most people are surprised at just how high these figures can be and it proves to be an effective tool in motivating employees and management to support loss reduction exercises. The Retail Equation group (28) also uses a measure to show how many jobs at an average wage could be supported by a reduction in loss due to fraud or abuse of the returns system. Highly visceral measures such as these are known to have greater impact.
Best practice is found in organisations that regard returns as a profit centre. In other words, close attention is paid to income as well as costs. One emerging example is to train staff at store or RC to send products to retail (at store, to a company specialist discount outlet etc.) rather than to jobbing or landfill. This company discovered that jobbing is perceived as the default option for employees in the RC. In store, staff made some minor repairs to achieve a sale rather than send an item to the RC and this small initiative had been beneficial in terms of decreasing the use of secondary markets and increasing re-sales.
Complex customer communications
Multiple returns channels, multiple points of contact and a ‘customer first’ culture are all good practices. However, we found several instances where communication between the business and its customers, its employees and its third-party logistics providers exacerbated the issues of inaccurate returns codes; duplication of refunds; increased rates of return; loss of income from an exit route; and fraud. Companies that only offer online sales and do not allow guest checkout have an advantage when it comes to returns. The customer must complete an online return form with a reason code against their own account and can then print off a returns label for postage or collection. Where items are individually identifiable, that is having a unique RFID rather than a batch ID, traceability is also enhanced. In both cases, items can be associated with customers and tracked through the returns process, with the corresponding reasons for return and costs, along with the dates at which the order was originally fulfilled, identified for monitoring purposes. However, we only found two firms which use ‘customer account sales only’ policies; only one that was in the process of moving to individual product tagging, and just one that already has this tagging in place. In the majority of cases, there are a number of routes by which a customer can make a return, each with its own set of instructions. Once in the system, the return can generate a number of subsequent communications to confirm the return and its processing.
Problems occur when items are returned in store, and particularly where they are returned to a dropbox: it is possible for the return not to be matched with the sale, and the confirmation to be missed. We found that most retailers had a significant number of transactions relating to returns where the sale, the return and the refund could not be reconciled. Finance personnel from Companies 3 and 4 stated that an even worse case are so-called ‘unallocated returns’, where products are returned via mail without any information about the reason for the return, the order or the customer’s identity. Simplifying and streamlining communications may reduce complexity in the returns process, but specific research with customers is required to develop the optimum communication path for individual businesses.
Taking Company 4 as an example, a customer purchasing online and collecting in store gets a text message to inform them that their goods are in stock and ready to collect. A second text message is sent to confirm they have collected the order. Should the customer then decide to return the product back to the ‘Click and Collect’ point, they again receive multiple texts: the first to confirm the drop off, a second to inform them that the product is back at the RC and a third to confirm that their refund has been processed.
Further communication problems were found in the processing of returns. These largely related to the decision about which exit route an item should take: one example is items being sent for jobbing or waste when it could have been returned to manufacturer or store.
Best practices in customer communications
Good communication with customers is recognised as not only improving customer experience but playing a role in reducing product returns. For example, Company 2 described how advertising their customer telephone helpline (printing details on product receipts in store / displaying details on online order confirmations) has reduced returns, particularly for electronic / technology devices and self-build products:
“we try to direct the customers to contact the helpline …. we can resolve the queries over the phone a lot of the time and give the customer a better experience by helping them out with the problem as it is, and preventing that return coming back, thus preventing any impact through loss or shrinkage.” (Loss Specialist, Company 2)
As previously discussed, return rates are higher in online retailing for certain product categories, as the customer is unable to see or try on products before purchase. Improved communication with customers, e.g. easy access to size guides (one click from the purchase page), improved product shots, online videos etc., may reduce poor purchase decisions and hence return rates.
Other organisations invest time and resources in their IT systems to ensure that the interfaces are easy for employees in store and in RC to enter codes and tracking data. This includes the use of handheld devices that can access information about the product and assign return bar codes to the item at point of return. Better systems feature built-in advice on whether a contractual return to manufacturer should be invoked, or how minor damage to packaging still allows for sale at full cost. Training and guidance pay off in increased income from returns. Communicating the benefits of this recovery of income can be built into target incentives in contracts with third party logistics companies to encourage them to train their employees to treat returns with care.
Future opportunities lie in creating coherent IT systems designed to separately identify and track transactions from the online business throughout the organisation. Automated ‘check-ins’ are another possibility. These could include photography of items and scales to check weights, as well as carefully graduated questions to take the customer through the process and allow for reasons for return to be captured before directly recrediting a credit or debit card. Simplifying and improving instructions and processes for returns offers ‘quick wins’ in terms of customer satisfaction and fraud prevention.
Another important element for best practice lies in how well organisations communicate with their staff. The best practices that we saw included clearly written manuals with screenshots, diagrams and photos for each step of the process. As well as this, one company ensured that many screens, dashboards and spreadsheets used by staff in store and in the RC contained simple explanations of why the task needed to be done and why it needed to be done in a certain way. There is feedback on ‘dwell times’ (the time between being received in store and then received in the RC) and ‘lost in transit’ items that lead to stores being charged for losses on returns. Examples of savings are given and progress period on period is highlighted and celebrated. This case study company had achieved an improvement against net margins of around €11 million over four years and attributed this success to continuous communication with staff at all levels of the business across the country. They had applied the principles of lean management and continuous improvement to their returns process, and saw dramatic results.
From this example and our other findings, we conclude that there is a missing element in the fundamental approach to returns. Many retail organisations position themselves as ‘lean thinking’ in terms of consideration of the customer and in the management of inventory. However, there is no corresponding line of thought either in research or practice as to what a lean returns system would look like. We believe that developing a lean thinking approach to returns would help companies move towards having a less complex and less costly returns environment, one that can be more realistically called ‘omnichannel’.
An introduction to our ideas for lean thinking in retail is given in Section 5.2.
Sustainability and the circular economy
Most retailers list sustainability as an important aspect of corporate social responsibility. Case study companies and respondents of the structured interviews described some examples of good practice, but gaps exist in practices across the retail industry.
To extract maximum value from product returns, the aim is to re-sell at full or slightly discounted price at regular stores. Where this cannot be done, many retailers have established other routes to market such as own brand eBay stores, bricks and mortar cut-price outlet stores or sales to staff (and sometimes local communities) in special shops.
Some retailers have in-house staff who do minor repairs on damaged goods for direct resale. However, only one case company engages in a form of basic remanufacturing / repair in their own RC, by assembling returned bikes and sorting out minor issues before resale (Company 2). A lack of trained staff, the need to keep a stock of spare parts (which become obsolete when products change) and a lack of space were identified as some of the challenges organisations face in setting up cost-effective repair centres in store or at RCs.
Another challenge is the relatively low value of some products: it may simply not be cost-effective for organisations to repair (or even test and repackage) items for sale:
“... the last exit is one that we need to look after, it’s our recycling exit, where we have a lot of stock that comes back that just isn’t worth throwing any more money at. So we do a value range of cheap kettles, toasters, microwaves, quite a lot of small domestic appliances, which a lot of it’s become quite a disposable kind of item …” (Logistics manager, Company 2)
The re-use or re-purposing of some products is seen, particularly where companies aim to minimise the amount of products going to waste. Certain companies emphasise that no clothing goes to landfill, using established relationships with charities to dispose of end-of-season and imperfect stock.
Over-packing of products has become a point of sensitivity with customers and governments (29), however for products purchased online, retailers face the challenge of balancing overuse of packaging with the need to protect delicate items in transit. Appropriate packaging can also help to reduce theft and fraud, without which business costs - and the end price charged to the customer - can rise. Some of the case study organisations spoke of the rationalisation of pack sizes, which both reduced purchase costs and simplified operations, but which can add to the perception of over-packaging. It is often not possible to re-use packaging materials, but recycling of packaging is commonplace.
Recycling of other reusable materials was also seen in some companies, for example recycling of fabric:
“... leather used to go, I think, to Italy, cashmere and wool go for recycling, denim goes for recycling ...” (Loss prevention manager, Company 1)
For electrical and electronic products, companies based in the EU are obliged to operate according to the WEEE (Waste Electrical and Electronic Equipment) legislation. Producers (or importers) and retailers have responsibilities under this legislation. In the UK, for example, retailers have a responsibility to store, transport and dispose of WEEE in accordance with the law.
“So we obviously have an obligation under the WEEE directive, but everything else we need to make sure that we’re recycling in a moral and ethical way, so it goes to a registered recyclist.” (Logistics manager, Company 2)
Where direct recycling, refurbishment or resale is not possible, companies use jobbers. Specific contractual arrangements are required to protect brand equity and to ensure that ‘seconds’ or ‘B grade’ stock are not purchased via alternative routes and then returned to the retailer for a false refund. However, some products will ultimately go to waste, either to landfill or waste-to-energy plants.
When questioned about the amount of products going to waste, some organisations claimed to not send any products to landfill. This claim is a stark contrast to published data on the impact of returns. For example, Tobin Moore, co-founder and CEO of Optoro (a technology company focused on improving the ‘reverse logistics’ of consumer returns), has been quoted as stating: “It’s a huge environmental impact - it’s over 4 billion pounds of [landfill] waste generated a year in the US from reverse logistics” (30).
We found that most retailers lack insight into the volume of products sent to waste by jobbers when they are unable to sell the product through auction or other means. This significant knowledge gap has the potential to undermine organisations’ corporate social responsibility commitments. Particularly with changes in global markets for recycling, a better understanding of this end of the reverse supply chain will become increasingly important.
Managed passively, returns might be seen as a cost of doing business but this ignores the relevance of sustainability to consumers. The potential for increasing revenue through customer appreciation of the business and through customers taking more care of the items that they return so that they are available for resale, for example, is one example of how treating returns as a profit centre could be beneficial.
In Section 5.3, we set out the key factors that retailers should consider in contributing towards a circular economy and the opportunities to better exploit secondary markets.
Three Ways of Re-Thinking Returns
A Cost Calculator for returns from online business
The model we propose allows risk-based ‘what-if’ scenario exercises to be calculated based on a cost of returns that draws in all the factors we found in our study. Most importantly, the model recognises that the cost of returns has an effect on the contribution to margin.
It uses average and benchmark numbers, but this has the advantage of highlighting issues that a straight presentation of audited absolute amounts spent would not highlight. This includes the fact that cost of returns does not vary greatly with the amount spent by the customer or the value of the items returned. It also shows that initiatives to reduce the rate of return by even a small amount can have a significant impact on the net margin. This impact can be the equivalent of making many more sales or the cost of employing several people. It demonstrates the value of treating returns as a potential profit or savings centre.
The model uses the items shown in Table 3. It also acts as a checklist to verify the completeness of online and returns data systems for development purposes.
Table 3 Items used in the cost of returns model
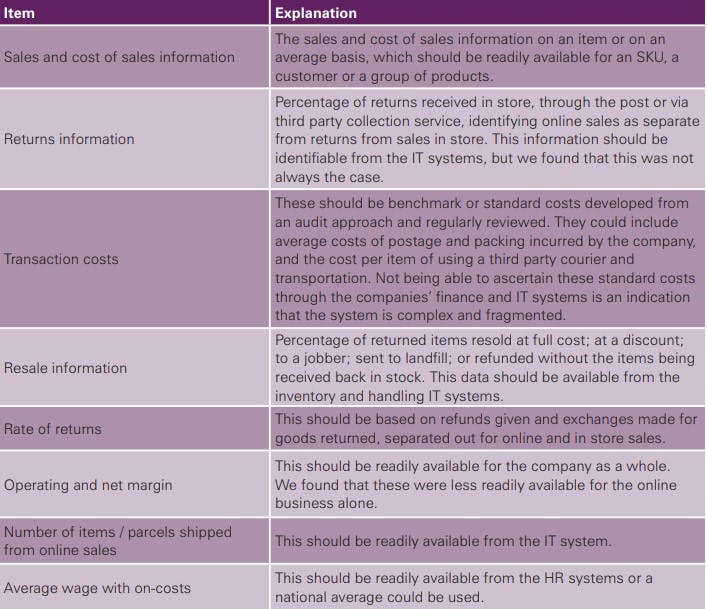
Using this framework, we have created a spreadsheet based on equations by Asdecker (31) that calculates cost of returns and the maximum level of returns before profit begins to be eroded. It also provides a ‘what-if’ scenario planning tool to test the effects of measures to prevent returns or increase sales.
Asdecker (31) provides the most sophisticated equations currently available in accounting for calculating the cost of returns and the effects of preventative measures relating to consumer returns. This is because his equations recognise that the sales process is circular rather than linear: in simple terms, a returned item may be resold and returned again. This causes a build-up of potential cost in the system. The model also recognises that there is more than one outcome for a returned item - it may be sold at full price, or at a reduced price, or at a reduced price after re-conditioning or written off. The probabilities of each of these events are written into the equation. We added one more possible event into the equation: the probability that the refund may be given but the goods never received.
In addition, the original equations were developed for a purely mail-order scenario. We have adapted them for three returns scenarios: return to store, return by post and return via third party courier or collection point.
To test the spreadsheet we created a hypothetical example as, unfortunately, none of the case study organisations were able to supply all the data that we needed. This was largely due to the fragmentary nature of their systems, and lack of coherent data as discussed in Sections 3.4 and 4.2. In developing the hypothetical case we chose an existing company where online business figures are available publicly through their strategic report to provide basic data for the calculations. We supplemented these figures with benchmarks taken from reliable sources. The results were checked back against Asdecker (31) and against the internal documents we had access to from case study companies to assess the reasonableness of our findings. The data used is given in Table 4.
There are three scenarios below. One looks at the impact of returns per customer and one looks at returns for an SKU. Both can then be scaled up to estimate the overall impact on the company.
Scenario 1: Applying the model to a single SKU
A fashionable grey cardigan sells for €89 and costs €29. The gross profit margin is €60, the operating margin is around €21 and the net margin is around €15.
Applying the benchmark figures as set out in Table 4 (see page 33), the cost of returns for one grey cardigan is around €30. This is in line with data quoted in 2017 by KPMG (32): “It can cost double the amount for a product to be returned into the supply chain as it does to deliver it”. Pointing to the online purchase of a coat, for instance: “To pick and deliver an order costs between €3 and €10 in the UK – it could cost double or treble that to be processed on the way back.”
Assuming that not all cardigans will be returned, the maximum rate of return that the company can withstand on these grey cardigans is 70%.
For the cost of returns to be less than the net margin, we need to ensure that the cost of returns is less than €15. This happens if the rate of return is around 20% in the model. However, we should be concerned. KMPG (32) indicate an average rate of return for clothing of 35%. Other reports indicate that the rate of return on online sales of clothing can be as high as 70%. A significant effort is required to ensure that the customer makes a good choice first time around and there is a significant risk that we cannot make a profit selling these grey cardigans online.
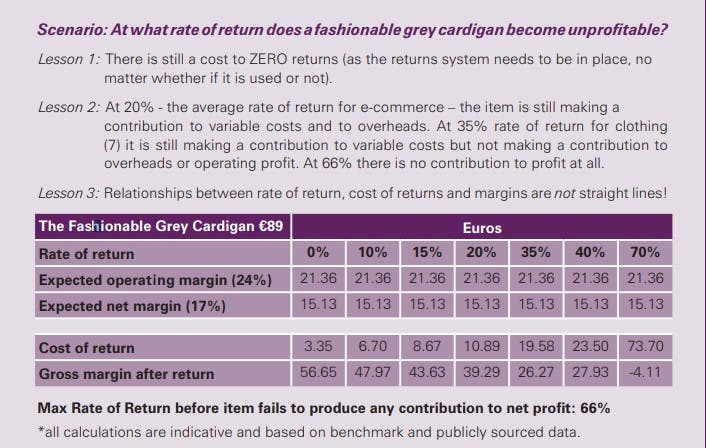
Further work is needed to make the model more robust and to build up benchmark figures that businesses can use to test out propositions for increasing sales or reducing the rate of returns, or both. However, we believe the model provides a basis for a better understanding of the true costs of ‘Buy Online, Return in Store’ and can be used to demonstrate to senior management the impact of strategic decisions for moving into an omnichannel environment.
Scenario 2: The true cost of returns for a typical online customer
Alex spends around €340 per annum on clothing. Being an average customer, they return 35% of the items bought (around one in three according to KPMG (32)). If Alex kept everything they bought that year, the operating profit (after overheads but before tax, financing costs and dividends) for the company from these transactions would be around €81. The net margin would be around €57.
However, the total cost of returns for this customer based on our calculation is €24.12, again in line with the KPMG findings (32).
The cost of returns directly reduces the operating profit gained to around €57 and the net profit gained to around €33. To make up for this loss in operating profit, the company needs to sell items equivalent in value to 0.3 of the sales. In other words, for an average number of returns on average sales of €340, they need to sell another €102 of goods to make up for the profit lost due to the returns. The maximum rate of returns per customer the company can bear before making a loss is 77%.
Intuitively, if Alex spends less, the cost of sales (including cost of returns) should drop and if they spend more, it should rise. This does happen – but not by as much as you might think. This is the crucial point in understanding the true cost of sales to an organisation.
If we drop the amount Alex spends per annum to €75, the cost of returns is still €19.85. If we raise the amount they spend to €750, then the cost of returns is €30.75.
This is the key point: the costs associated with returns are largely fixed and vary less than expected with the size, value and frequency of returns.
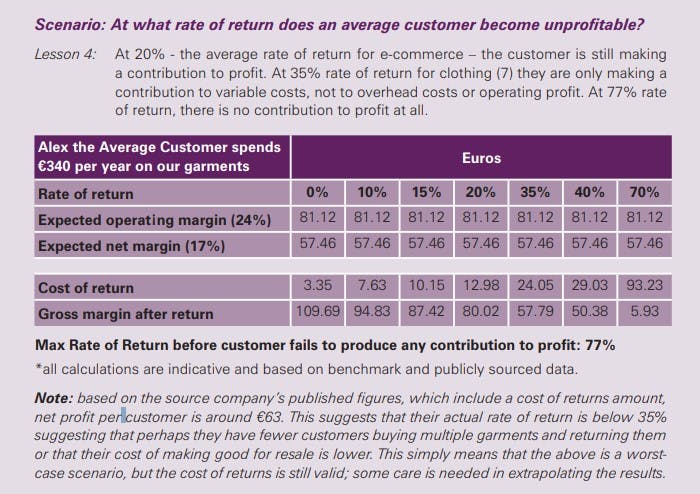
Organisations have to create systems to manage their online returns and these carry a significant fixed cost. We can think about it this way: the system has to be in place, be maintained and have sufficient capacity to manage high days and holidays. The customer has been promised the facility to make free returns through a variety of sources and the system has to be there, whether or not the customer chooses to make use of it. The problem is that companies are not necessarily increasing prices or charging costs to the customer to pay for this additional infrastructure. It is seen as a cost of doing business, but as our hypothetical case study above shows, the costs have a direct impact on operating and net profit.
To paraphrase a quote from the author and former farmer Adrian Bell in the 1930s (33):
The customer:
“For the privilege of buying a chicken prepared for the oven whenever you want you have to pay for all the days the chicken was there and you didn’t want it.”
The Store:
“For giving the customer the opportunity to make returns whenever they want in the expectation it will increase future sales, you have to pay for all the days that they don’t make use of it – and all the days they choose to overuse and abuse it.”
Extending the scenario: providing incentive schemes to customers to reduce the likelihood of returns
What if we introduced an incentive scheme for customers designed to prevent ‘wardrobing’ that decreases the rate of return by 5%, from 35% to 33.25%?
The bad news is that sales might go down by 3%, that is by around €10, losing a net profit of €2.43. However, we find that the total cost of returns for this customer based on our calculation is €21.38, a reduction of €2.71 or 11%. This saving goes directly to operating profit. In other words, sales might go down but the net increase in the bottom line is around €0.28 per item.
Scaling this up for the whole online business, this could mean a reduction of up to €4.5 million on cost of returns, which would be an improvement of up to €4.5 million in net profit – the same net profit that could be made from achieving additional €27million in sales and the equivalent of employing around 90 people at average wage that includes on-costs.
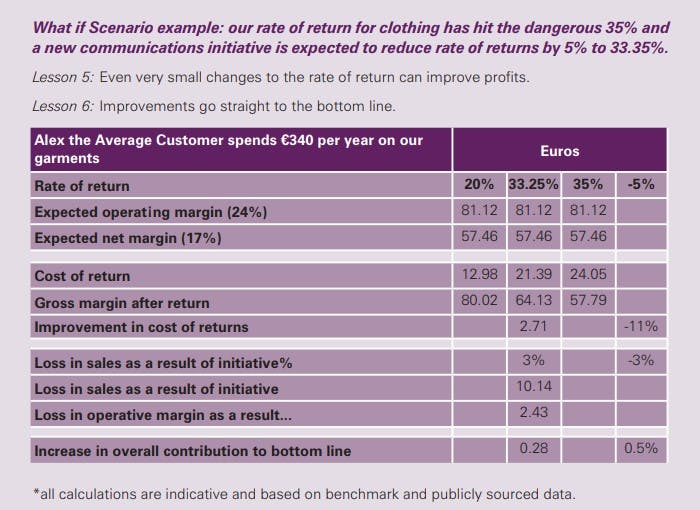
Extending the scenario further: providing incentive schemes to customers to increase online sales.
What if we introduced a scheme to incentivise customers to buy more items online but also increasing the rate of return by 5%? This time, the model shows that whilst sales go up, the net decrease in the bottom line is around €0.28 per item, which would be a loss similar in scale to the loss of up to €27million in sales.
Ideally, what is needed is a way of increasing sales but decreasing the rate of return. As Asdecker et al. (24) show, increasing sales does not necessarily lead to a proportionate increase in the number of returns, as this depends largely on the composition of the basket. For example, if customers are encouraged by the incentives to purchase the same item in several sizes, then it is likely they will keep at least one and return all the others. An incentive that increases sales but makes customers more confident that they are choosing the right size and avoiding their own personal cost of returns in terms of time and hassle would be beneficial.
We suggest that initiatives for better communication with customers, which can be fairly inexpensive to implement, might achieve the double benefit of increased sales and decreased rate of returns.
Scenario 3: Quantifying the impact on net margin
Using the figures in Scenario 1, we can see that a 5% decrease in rate of returns delivers an impact on the bottom line.
At a 35% rate of return, the net margin is €282.39 million. If the initiative delivers a 5% improvement in rate of returns – that is, the rate of return is now 33.25%, rather than 35% - then the saving on the cost of returns could be €5.2 million which equates to a 2% or 200 Basis Points improvement on net margin. That is the equivalent of finding €30 million in additional sales to deliver the same net margin improvement. It is also the equivalent of employing 102 people on an average wage (including on-costs).
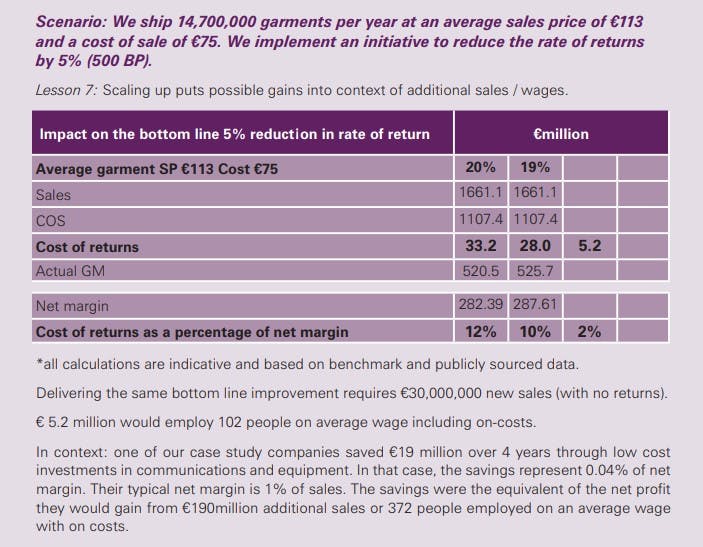
Summary of operational steps that loss managers can implement in relation to the cost of returns model:
- Validate and/or adapt the cost of returns model.
- Look for better communications to deliver customer satisfaction and reduce rate of returns.
- Use the cost of returns checklist in Table 4 to help improve the collection of relevant and necessary information for managing returns.
- Have a closer look at buying decisions and impact of cost of returns at the early stages of negotiation, not after most items have been returned.
Table 4: Checklist and explanation for cost model
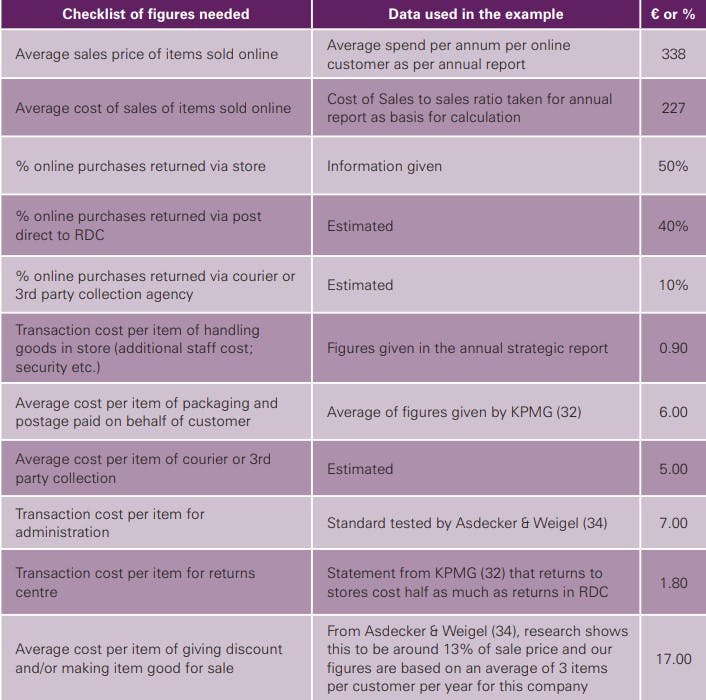
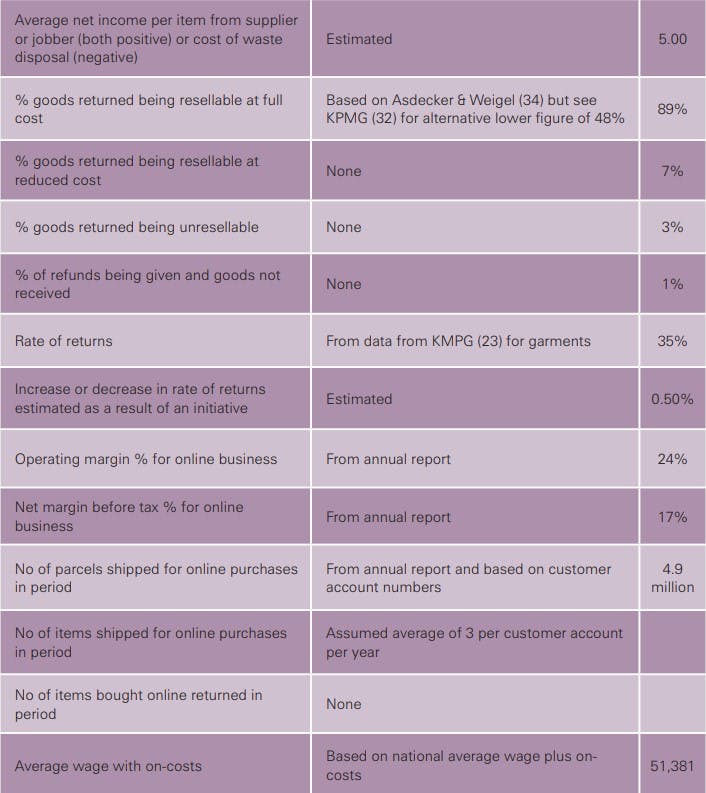
Notes: KPMG (23, p 9): average cost of next day delivery €5.43, 3-5 days €4.81, other €7. 35% of women’s fashion online purchases were intentional returns (23). According to Gartner research cited by KPMG (32), only 48% of returned goods can be resold at full price. Calculations for equivalent costs in sales and number of jobs are based on work by The Retail Equation (28). We have also adopted The Retail Equation’s suggestion that rates of return should be based on items refunded and items exchanged: many variations of the rate are just based on refunds received. Exchanges incur costs, and therefore need to be worked into the calculations.
Lean Returns in Retail
Online shopping is meant to save time and resources for the business and the customer but often it is a drag on both business and personal resources. To create a win-win situation for all parties, better ways need to be found to nudge customers to make the right decisions first time, reduce the time spent making a return and to reduce the risk to the business of losing all the profit on a sale through damage, waste and poor communications. We contend that what is needed is lean management thinking for returns that would benefit both the business and the customer.
Lean Management Thinking in Brief
- Less Waste
- Less Time
- Less Volume
- Less Risk
However, while we found a number of examples of lean thinking in retail we observed that returns processes are not yet lean. On further research, we found that there is little research on lean returns processes and that is perhaps not surprising. If a forward lean thinking system is working, then there should be zero defects and zero waste, and a culture of getting it right the first time – in other words, no returns! But returns are a fact of life in retail and part of doing business. Lean returns processes are needed that can be integrated with the established lean thinking sales systems in place. We could also call this ‘lean thinking reverse logistics’ and that is helpful, as thinking in reverse is needed for this issue.
The basic principles of lean are, as shown in Figure 5 below:
- Focus on effectively delivering value to the customer
- Respect and engage the people
- Improve the Value Stream by eliminating all types of waste
- Maintain flow
- Pull through the system
- Strive for perfection
All of the above are said to lead to increased customer satisfaction and increased profitability
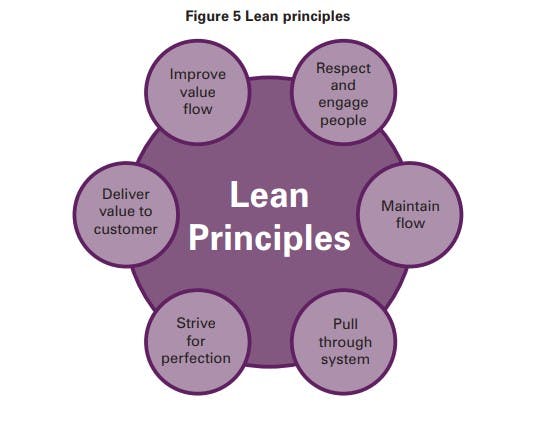
Focus on effectively delivering value to the customer
In our research, all the organisations we spoke to are focused on delivering value and providing an excellent customer experience. The driver is to increase sales. But we found two things:
- Giving more options and freedom to customers significantly increases the chance that customers will take advantage of the opportunities offered, leading to increased processing costs and increased losses for the organisation.
- Lean thinking theory and practice is based on the premise that there is one type of customer with one set of needs, and this customer tends to be idealised. Conventional lean thinking does not sufficiently take into account the range of customer behaviours.
The starting point for reverse thinking in lean logistics requires some lateral thinking:
Who is the purchaser in a returns system?
Answer:
The purchaser in a returns system is the retailer, and the retailer needs to decide whether to make the purchase from the customer or not.
To design a lean returns management system, it is legitimate to consider what works for the retailer. The first step is to consider the risks. These include the following:
(a) If the customer purchased the item and it was faulty, damaged or misrepresented by the seller, or within the 14 days allowed for online purchases, then there is a legal obligation to return and the sale is nullified.
Risk: the item cannot be resold for any amount and nothing can be claimed from the manufacturer.
Risk: the customer does not buy from the retailer again.
(b) If the customer changes their mind or bought several items knowing they were going to send some back, then they are effectively selling the item back to the retailer. The customer is legally entitled to this but it is up to the retailer as an organisation to decide how they then ‘purchase’ that item.
Risk: the item cannot be resold for any amount and nothing can be claimed from the manufacturer.
Risk: the retailer pays more in transaction costs than the resale profit margin on the item.
(c) If the customer asks for a refund but did not actually purchase the item or pay for it legitimately, the retailer is the customer who is going to be defrauded.
Risk: the retailer ends up paying the more than once for the item, and not receiving income from it.
Risk: the retailer pays to retain the customer but they never buy legitimately from the retailer.
Using lean thinking principles to address this scenario, the retailer as customer needs to consider:
- Does the returns process transform the product into something that can be resold or for which a claim can be made?
- What is the retailer willing to pay to customers and in transaction costs for the returns process, and is it value for money?
- Are returns done correctly the first time, in such a way that the non-fraudulent customer makes future purchases from the retailer?
Therefore, focusing on effectively delivering value to the customer in the reverse logistics setting means thinking about ‘how can the retailer as an organisation get value from the returns process?’
Respect and engage the people
In all the organisations that we spoke to, lean thinking means that all staff are trained and engage in selling to consumers. But who are the people involved in returns?
We found that where stores had a dedicated returns desk, staff were knowledgeable and engaged in the returns process, contributed ideas to make it work better and were careful of the items being returned. They also possessed knowledge of returns fraud practices by consumers and were more likely to identify and report potential fraudsters through understanding consumer behaviours. (On the downside, there is a risk that staff may use their knowledge and access to systems to carry out internal frauds.)
Notwithstanding, we heard a number of stories that suggest that the above scenario is not always the case in retail organisations. Losses through returns are often seen by management as irritating but offset against increased sales. The problem is that ‘Click and Collect’ and other omnichannel developments are leading to increasing losses which have significant impacts on profitability, which in time will affect the organisation’s ability to re-invest and delight its customers.
We found an example of lean best practice when third parties were contracted to run RCs. Incentives are built into ‘target cost management’ type contracts to ensure that the management required their staff to respect and engage in the returns process for the benefit of the organisation. We also saw that where a loss reduction project has support throughout the organisation, loss prevention colleagues are able to achieve more savings.
In any lean thinking system, everyone from the leadership through to temporary casual workers should be respected and engaged in the returns process.
Improve the Value Stream by eliminating all types of waste
One of our best practice case studies talked about their returns as assets which generated a cash flow and had the ability to impact the bottom line of the whole business. They had mapped out all the exit routes for returns and monitored reduction in losses/waste. They also calculated the loss reductions in terms of the equivalent amount of sales needed to improve the bottom line to the company.
In lean thinking we need to consider what wastes our time, our resources and our money? The following questions need to be asked:
- Can we simplify returns systems by having very clear entry routes (for products returned by consumers) and exit routes (for products going back into the supply chain)?
- What is the ideal state of the returns system and can we map the flows?
- Is everyone educated to maintain flow? Are computer-aided recording and decision-making systems helpful or a hindrance?
An example of this involves supplier contracts. Have all contractual clauses been identified where the manufacturer takes the cost of returns, and is the system able to highlight all of these and to monitor the amounts received? Are all contracts and agreements with suppliers written in such a way as to allow costs to be reclaimed in reasonable circumstances?
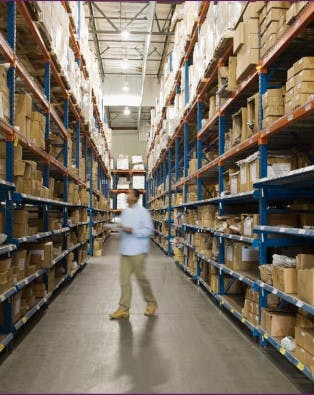
Push or Pull through system?
In returns, we have a push system based on supply rather than a pull system based on demand. To some extent, this supply can be forecast based on previous behaviours but it is not entirely predictable. However, we can control how product is pushed through exit routes, and therefore there is some scope to make a push system flow back into the pull system in sales.
Therefore, the following questions need to be asked:
- What are we doing to reduce the supply of returns, as it does not benefit us?
- Can we reduce the number of points of entry for returns and/or reduce the scope for customer error on returns?
- Can we offset returns with an alternative sale in order to avoid overloading / balance out sales inventory?
- Can we link up systems such that near real-time information is available to all staff?
- Can we identify and prioritise products and exit routes? Can we incentivise / nudge customers to help? For instance, sales items have to be returned within a short time window to be put back on sale (e.g. return fashion goods whilst they are still in season), or simply not accepting returns on sales items (within any legal constraints for faulty goods or the 14-day time limit under distance selling regulations).
There are signs that companies are starting to think lean in returns. KPMG (32) find that the approach taken to organising reverse logistics has evolved over the last few years, with traditionally about a dozen steps being reduced to a strategic 3-4 steps. Others find that “for companies to capture additional profit from optimising their reverse logistics, it is essential for them to recognise the importance of streamlining their reverse processes and having responsibility and visibility at executive management level” (26), which requires the measuring and monitoring of relevant KPIs (35). There is scope though for a more thorough design of lean thinking in reverse logistics in retail to be carried out by the industry.
We suggest that the questions provided above be used as a starting point for the development of lean returns management in retail.
Summary of operational steps that loss managers can implement in relation to lean management in returns:
- Map out the reverse logistics process and look to remove steps
- Improve communications with customers to reduce returns
- Improve communications with employees to maximise income from returns
- Identify areas for improved data collection and information processing
Rethinking for a circular economy
Traditional economies are linear; they “take, make and dispose” (36). A more sustainable approach is suggested with the concept of a circular economy, whereby waste is avoided and negative impacts reduced as much as possible. Products and components are redesigned to be reused, repaired, remanufactured. Resources including energy, water and materials are recycled. A by-product from one process may become a nutrient for another process. To this purpose, companies in different industries increasingly collaborate, making their operations more effective and efficient, designing waste out.
In their Action Plan (37), the European Commission is emphasising the importance for all countries to work towards a circular economy. This is in accordance with the U.N. 2030 Agenda for Sustainable Development (38) and the G7 Alliance on Resource Efficiency established in 2015 (39). A more circular economy will be essential for reaching the Sustainable Development Goals (SDGs) by 2030, in particular Goal 12) Sustainable consumption and production, but also 9) Industries, innovation and infrastructure, and 11) Sustainable cities and communities.
The flows in a circular economy are often shown with manufacturing in the focus, and returns being neglected. Figure 6 illustrates flows originating from the point of return. The products may follow various paths: via donation directly back to a second use; going back to the shelf to be sold again as-new or for a reduced price; on to a second market, possibly using a targeted auction, and via distribution; getting a new packaging or undergoing refurbishment and going back into distribution; being remanufactured (the full product or parts being harvested) and entering the stream again at the manufacturing stage.
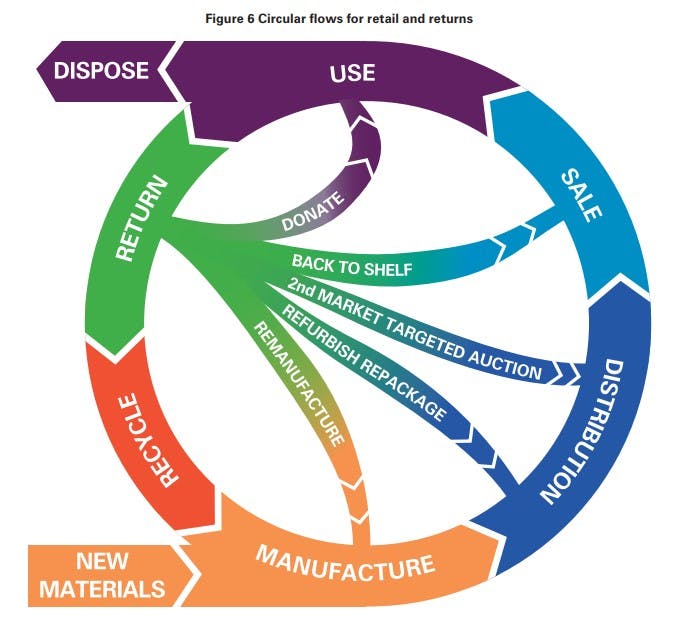
The Circular Economy Handbook (40) offers an in-depth discussion of principles and opportunities across industries and all along the value chain. To achieve such a vision requires organisations to have crossfunctional teams looking at problems in a holistic, integrated manner. This would require strategic vision and executive oversight of the issues involved. From our work, consumer returns in online environments are the focal point that could drive the achievement in the long run of omnichannel environments that are part of a circular economy.
Summary of operational steps that loss managers can implement in relation to circular economy:
Logistics:
- Introduce reusable packaging solutions (e.g. shipping cages with lids).
- Avoid shipping items where possible / use empty return runs.
Store infrastructure:
- Reduce carbon footprint.
- Collect and use rainwater.
- Capture and reuse excess heat.
At the store:
- Encourage customers to reuse their bags (remind them at the car park!).
- Repair small defects (where possible in-store) and resell the product.
- Sell used / imperfect / out-of-season products to a 2nd market.
- 2nd hand corner in-store / store for reused goods.
- Offer a take-back scheme for products.
With suppliers / manufacturers:
- Avoid single-use packaging materials.
- Use biodegradable plastics and single-material packaging.
- Systematically collect plastics for recycling at every stage, including production, logistics, sales and taking them back from consumers.
- Reduce packaging e.g. stop packing every garment into plastic film individually.
- Eliminate / reduce pesticides and other toxins in production.
- Redesign / encourage manufacturers to redesign their products for easy disassembly, repair, recycling.
- Refurbish / remanufacture products or partner with organisations that do.
- Form an industrial ecopark with neighbouring companies.
- Use sustainable, fair-trade suppliers.
Conclusion and future opportunities
Omnichannel retailing is an aspirational vision. Customers have a seamless shopping experience, moving between shopping in store, over the telephone, at their desk on a laptop or PC, or on the move via smartphone or tablet to purchase items as and when they choose to do so. The items are delivered at speed to wherever they choose to receive them – home, in store, at a collection point, at work – at low or no cost to them. Customers can choose to return the item as and when they wish, through the most convenient channel to them at the time and again, at low or no cost to them. They receive prompt refunds and exchanges, with their accounts displaying their current payment status on demand.
Behind the omnichannel surface, a highly integrated IT system is able to keep the customer account updated in near real-time. Inventory, logistics, sales and returns systems are linked through individual product identification and customer accounts, meaning that each item can be traced and located at any point in time. Despite working at speed, losses are minimised and all transactions can be reconciled. Interactions between customers, retail staff and suppliers are transparent and conducted fairly and efficiently.
As we found in this research on ‘Buy Online, Return in Store’, very few businesses are actually designed to be omnichannel. The different physical and Internet offerings to customers have evolved with the availability of technology and competition in the marketplace. At best, retailers can offer an integrated multichannel approach. The customer has the choice of where to buy and where to return items, and branding creates something of a seamless front. Behind the shops and screens, existing systems are linked together – more or less successfully – to provide the data needed to track and trace items and transactions. The potential for error, omission and fraud by customers, employees and third parties is increased. One cause is the rapid deployment of new processes imposed on existing systems as businesses try to integrate their offerings and systems.
Our report shows that there are ways for retailers to move towards the omnichannel vision. They need to:
- Get to know the impact of the cost of returns on their business and the potential for improving net margins by reducing the rate of returns and increasing the income available from returns.
- Make returns processes leaner and more efficient.
- Think more expansively about where returns fit in the circular economy.
To achieve these aims, we suggest that making returns activity effectively a profit centre, led by senior management and with a cross-functional team engaged in maximising the benefit from returns would bring an impact on the bottom line. Furthermore, the problems that ‘Buy Online, Return in Store’ have generated can act as a focal point for re-modelling the organisation to take advantage of the opportunities technology and customer demand bring to retail.
Future opportunities
RFID technologies can be exploited further. The use of RFID to identify individual items, rather than batches, would enable retailers and their suppliers to track returns better. The benefits would include more accurate inventories and better forecasting for replenishment. In addition, costs may be reduced if the location of returned stock can be identified more easily. Losses through consumer returns fraud would also be reduced.
Marrying the omnichannel structure with the circular economy concept, and using modern technology, a brand-specific platform could be created for optimising the (re-)use of products and minimising transportation. Customers could download an app that records what products were purchased and keeps track of their age, condition (which could be brand-new, used or damaged, etc.) and location, via user prompts or automated communication for electronic goods. The user would also inform the app if the product requires repair or if the product is no longer needed. Similarly, people wishing to purchase such a product or requiring a spare part would inform the app. The app could then, using some optimisation algorithms, determine which product or component should go where. Customers would print a label and ship the product to its future owner (or a repair shop), completely bypassing the physical store and distribution centre. To reduce fraud, customers would need to post pictures of the goods they are sending / receiving, and enter credit card data as a security. The brand would handle payments and could charge customers a small fee for using the app, just like other trading platforms do, whilst saving on costs for physically handling returns and improving sustainability by reducing waste and increasing the utilisation of their products.
Other uses for AI and machine learning include algorithms for identifying patterns of returns that indicate returns fraud. They may also be developed to improve forecasting and stock inventory management. The app discussed above may be linked into an ‘Internet of Things’ that automatically links to the information about where and how to repair and recycle the items.
Using more conventional approaches, it should be possible to develop benchmark data on rates of return, decreases in costs and in losses that could be used between retailers to drive innovation and best practice. Given that the returns figure in absolute terms is a small percentage of turnover, but with the potential to significantly improve net margins, there is less risk of sensitive information being made visible to competitors. Care could be taken to have relative movements rather than absolute figures in the benchmarks. The aim would be to drive industry best practice and steps towards zero waste.
The retail industry could also lead the development of lean returns knowledge and practices that would have the potential to enhance customer, employee and shareholder satisfaction with the services offered. Processes would be more efficient and less costly if the experiences found in forward operations in retail using lean management thinking could be applied to the reverse supply chain.
The final message is that returns from ‘Buy Online, Return in Store’ need not be a liability to the business or a drag on operations. Treating returns as assets with the potential to generate income and contribute to net margins is the key to realising a fully omnichannel shopping environment for the future.
References
1. Eurostat. (2018). Digital economy & society in the EU. A browse through our online world in figures. Retrieved from: https://ec.europa.eu/eurostat/cache/infographs/ict/2018/index.html
2. Ecommerce Foundation. (2017). Global Ecommerce Report 2017. Retrieved from: https://www. ecommercefoundation.org/free-reports
3. Winkler, N. (2018, September 25). Ecommerce returns: policy, rates, best practices & statistics (2018 Holiday Ed). Retrieved from: https://www.shopify.com/enterprise/ecommerce-returns
4. Dennis, S. (2018, February 14). The ticking time bomb of E-commerce returns. Retrieved from: https://www.forbes.com/sites/stevendennis/2018/02/14/the-ticking-time-bomb-of-e-commercereturns/#6521fc114c7f
5. Ram, A. (2016, January, 27). UK retailers count the cost of returns. Financial Times. Retrieved from: https://www.ft.com/content/52d26de8-c0e6-11e5-846f-79b0e3d20eaf
6. Bower, A.B. and Maxham, J.G. III (2012). Return shipping policies of online retailers: normative assumptions and the long-term consequences of fee and free returns. Journal of Marketing, 76, 110- 124.
7. KPMG. (2018). Annual Retail Survey 2018. Retrieved from: https://home.kpmg.com/uk/en/home/ insights/2018/01/kpmg-annual-retail-survey-2018.html
8. Elliott, J. (2018, April). Enhancing profitability and the customer experience through your returns strategy. Reverse Logistics Magazine, 90, 10-16
9. Speights, D. (2015). Return Rate Miscalculations Impact Retail Chains Nationwide Calculating Your Real Return Rate. Retrieved from: https://apprissretail.com/resource/white-paper-return-rate-miscalculationsimpact-retail-chains-nationwide/
10. Egan, D. (2016). Swimming upstream: navigating the world of reverse logistics. CBRE Research. Retrieved from: https://www.cbre.com/research-and-reports/About-Real-Estate--Swimming-UpstreamNavigating-the-World-of-Reverse-Logistics-March-1-2016
11. Panda, S. (2018, April). Two sides to every story… return logistics and return frauds. Reverse Logistics Magazine, 90, 18-20.
12. KPMG. (2016). Annual Retail Survey 2016. Retrieved from: https://assets.kpmg.com/content/dam/kpmg/ pdf/2016/02/omnichanel-retail-survey-2016.pdf
13. Bernon, M., Cullen, J. & Gorst, J. (2016). Online retail returns management: Integration within an omnichannel distribution context. International Journal of Physical Distribution & Logistics Management, 46 (6/7), 584-605, https://doi.org/10.1108/IJPDLM-01-2015-0010
14. The Retail Equation. (2013). Consumer returns in the retail industry 2013. Retrieved from: https://nrf. com/
15. Newcastle Systems. (2017, October 17). The importance of reverse logistics in your supply chain. Retrieved from: https://www.newcastlesys.com/blog/the-importance-of-reverse-logistics-in-your-supplychain
16. Blanchard, D. (2007, April 10). Supply chains also work in reverse. Industry Week. Retrieved from: https://www.industryweek.com/planning-amp-forecasting/supply-chains-also-work-reverse
17. Aschendrand, J., Mikita, M., Sciarrotta, T & Trebilcock, B. (2018, May). The circular supply chain. Reverse Logistics Magazine, 91, 14 -25.
18. Next plc. (2018). Results for the year ending January 2018. Retrieved from: https://www.nextplc. co.uk/~/media/Files/N/Next-PLC-V2/documents/reports-and-presentations/2018/Final%20website%20 PDF.pdf
19. Speights, D & Hilinski, M. (2005). Return fraud and abuse: how to protect profits. Appriss Retail. Retrieved from: https://apprissretail.com/wp-content/uploads/sites/4/2017/02/wp_TRE4013-WhitePaperReturnFraud101_Feb2013.pdf
20. Douthit, D., Flach, M & Agarwal, V. (2011). A “Returning Problem”. Reducing the Quantity and Cost of Product Returns in Consumer Electronics. Accenture. Retrieved from: http://www.wrap.org.uk/sites/ files/wrap/accenture-reducing-the-quantity-and-cost-of-customerreturns.pdf
21. Shopifyplus. (2018). 2018 holiday ecommerce guide. Retrieved from: https://plusinfo.shopify.com/ guide-to-holiday-returns
22. Blaeser, J., Iampieri, M. & Varma, R. (2018). Top trend in Shipping? Most customers want fast and free. Retrieved from AlixPartners website: /www.alixpartners.com/insights-impact/insights/top-trend-inshipping-more-consumers-want-fast-and-free/
23. KPMG (2017) Annual Retail Survey 2017. Retrieved from: https://home.kpmg.com/uk/en/home/ insights/2017/02/retail-survey-2017-what-consumers-are-telling-us.html
24. Asdecker, B., Karl, D. & Sucky, E. (2017). Examining drivers of consumer returns in e–tailing using real shop data. Proceedings of the 50th Hawaii International Conference on System Sciences, 4192 – 4201.
25. Wood, Z. (2018, May 22). Tesco shuts its non-food website, Tesco Direct. The Guardian. Retrieved from: www.theguardian.com/business/2018/may/22/tesco-shuts-its-online-non-food-website-tescodirect
26. Sciarrotta, T. (2018, May). Directing Reverse Logistics – A Corporate Paradigm Shift. Reverse Logistics Magazine, 91, 40-41.
27. Lambert, D. M., & Enz, M. G. (2017). Issues in supply chain management: Progress and potential. Industrial Marketing Management, 62, 1-16.
28. The Retail Equation, (2016).Consumer returns in the Retail Industry 2015.Retrieved from:https://nrf.com/ sites/default/files/Images/Media%20Center/NRF%20Retail%20Return%20Fraud%20Final_0.pdf
29. Sigalou, Y. (2018). Wrapping your head around overpackaging – and taking action. Retrieved from: https://zerowasteeurope.eu/2018/03/wrapping-your-head-around-overpackaging-and-taking-action/
30. Bain,M.,Slobbin, S. & Tabb, M. (2016)., Returned gifts are creating an environmental disaster. Retrieved from: https://qz.com/873556/returned-gifts-are-creating-an-environmental-disaster/
31. Asdecker, B. (2015). Returning mail order goods: analyzing the relationship between the rate of returns and the associated costs’, Logistics Research, 8 (3), 1-12.
32. KPMG, (2017). Future-proof your logistics. Retrieved from: https://home.kpmg.com/au/en/home/ insights/2017/05/future-proof-reverse-logistics.html
33. Bell, A. (1931). Silver Ley. London: Cobden–Sanderson.
34. Asdecker, B. & Weigel, A. (2013). The abuse of the right of withdrawal in online trading. (Der Missbrauch des Widerrufsrechts im Onlinehandel), estrategy Magazine, 13, 8-11.
35. Stuart, B. (2018, April). Wake Up: Returns are YOUR fault, not the customers. Reverse Logistics Magazine, 90, 22-24.
36. Ellen MacArthur Foundation. (2017). Concept. What is a circular economy? A framework for an economy that is restorative and regenerative by design. Retrieved from: www.ellenmacarthurfoundation.org/ circular-economy/concept
37. European Commission. (2016). Environment Action Programme to 2020. Retrieved from: http:// ec.europa.eu/environment/action-programme/
38. United Nations. (2015). Transforming our world: the 2030 agenda for sustainable development. Retrieved from: https://sustainabledevelopment.un.org/post2015/transformingourworld/publication
39. Federal Ministry for Economic Affairs and Energy. (2015). Kick-off event for the G7 Alliance for Resource Efficiency: Resource efficiency benefits both industry and the environment. Retrieved from: www.bmwi. de/Redaktion/EN/Pressemitteilungen/2015/20151002-g7-allianz-ressourceneffizienz-startet.html
40. Weetman, C. (2016). A circular economy handbook for business and supply chains: Repair, remake, redesign, rethink. Kogan Page Publishers
Appendices
Research Stage 1: Desk Review of Company Return Policies
Websites for 100 European companies, who have both a physical and online retail presence, were reviewed. Key findings are presented below.
Click and Collect: availability and cost to the customer
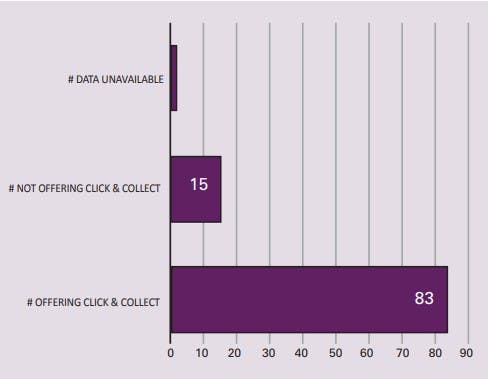
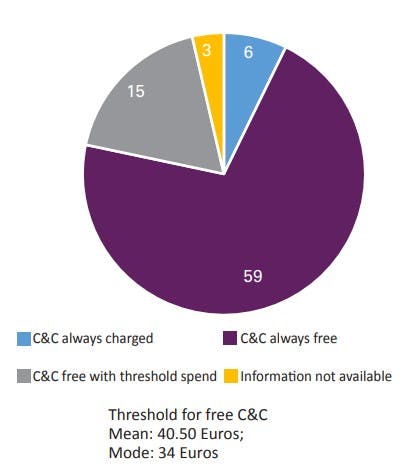
Cost of delivery for the customer
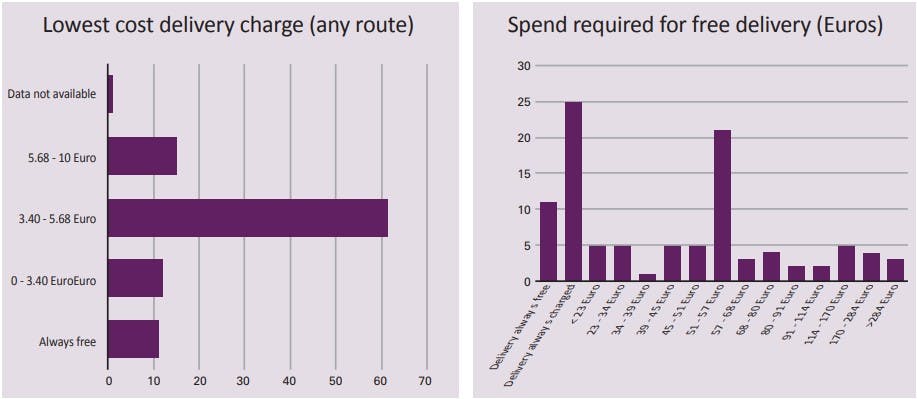
Return Policies: maximum return period allowed
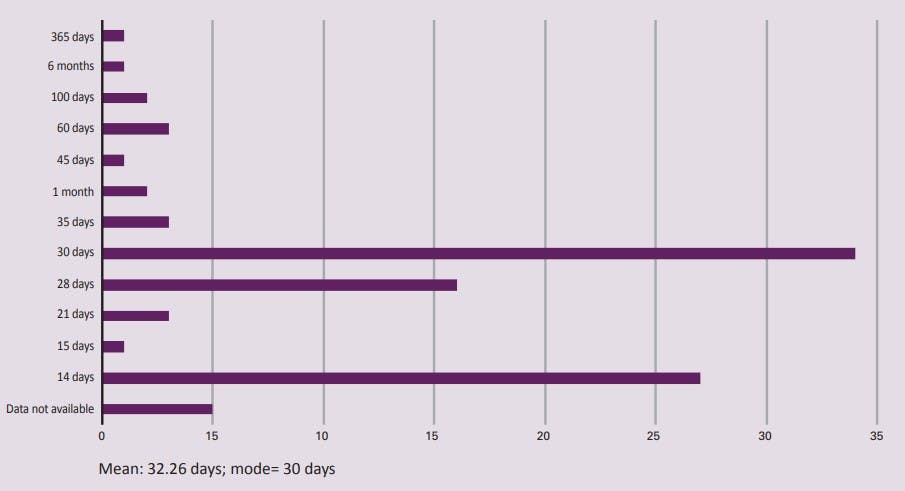
Product Returns
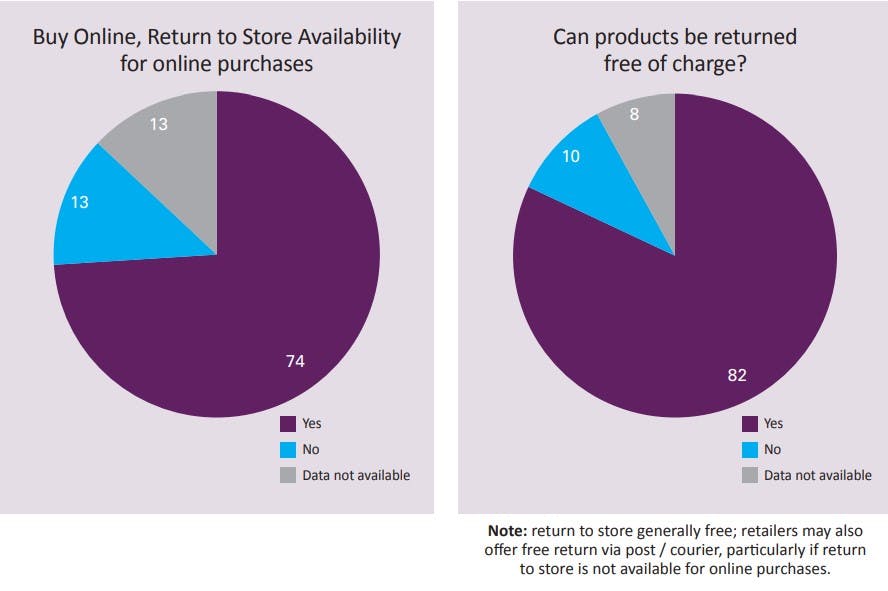
Process Flow Charts
Process flow charts were created for each of the case study organisations to map the journey of the product from the point of purchase (online or in store) to the customer and the returns process, looking in detail at processes in store and at RCs. The individual process flows cannot be shared as they contain confidential information, but generic process flows of the two major sections of the processes – from purchase to return in store, and the process at the RC – are shown here.
Process Map 1: from purchase to return, including in-store processes
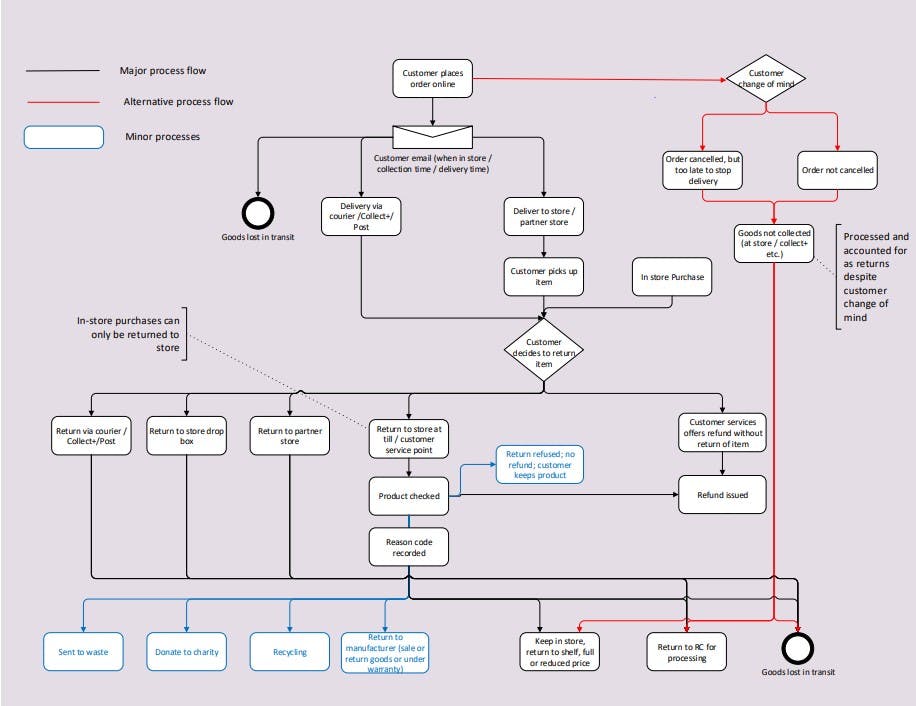
Process Map 2: Processes at the RC
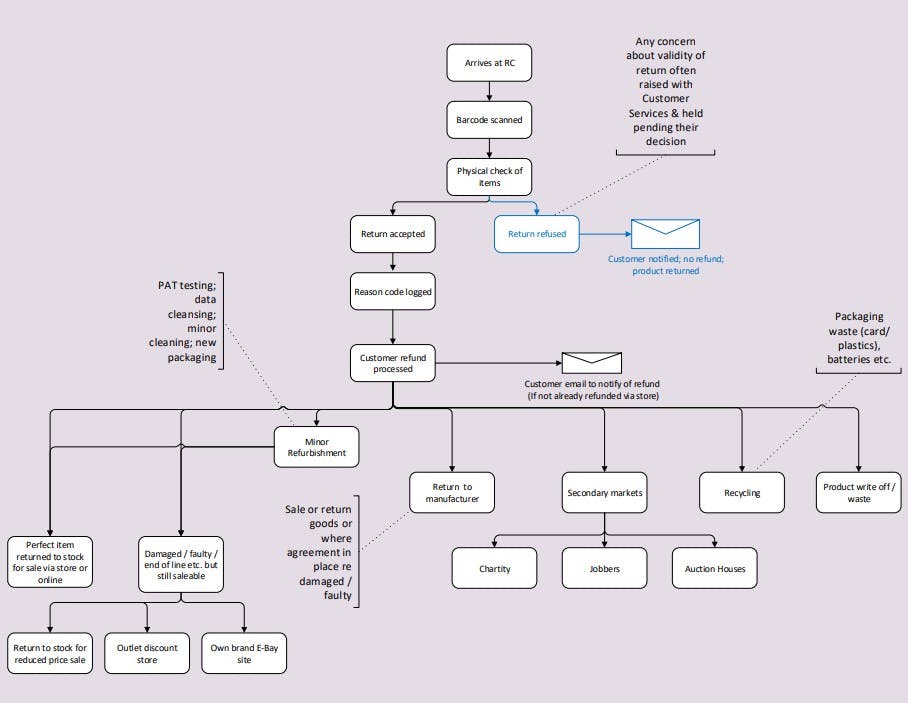
Cost of Returns Model – An Example


Main office
ECR Community a.s.b.l
Upcoming Meetings
Join Our Mailing List
Subscribe© 2023 ECR Retails Loss. All Rights Reserved|Privacy Policy